Dow Jones: Support at 30,816 and resistance at 31,333
FTSE 100 (#UKX)
The FTSE had an incredible week gaining +4.72% from last observation: a massive roll out of Covid vaccine together with Brent Oil price gaining momentum, gave a boost to the upside to the #UKX.
As we highlighted last week, the #UKX was forming an ascending triangle that got rapidly broken: the #FTSE reached 6,907 and then moved sideways for the remaining days.
From a technical perspective, the current trend of #UKX is bullish: the trend line started from 1/12/20 has been respected over this time. In addition, the 50MA is holding strong and overcoming previous levels of resistance.
However, the current distance from the trend line and the 9MA, together with a strong divergence between price and RSI leading us to think that the #UKX may retrace in the coming week: this would not impact the current bullish sentiment, but it make the uptrend healthier.
For the week ahead, we expect the #UKX to re-test first 6,800 and then the current support at 6,676.
For the moment, we exclude a break of the current upward trend line.
At present, we see support at 6,618 and resistance at 6,907.

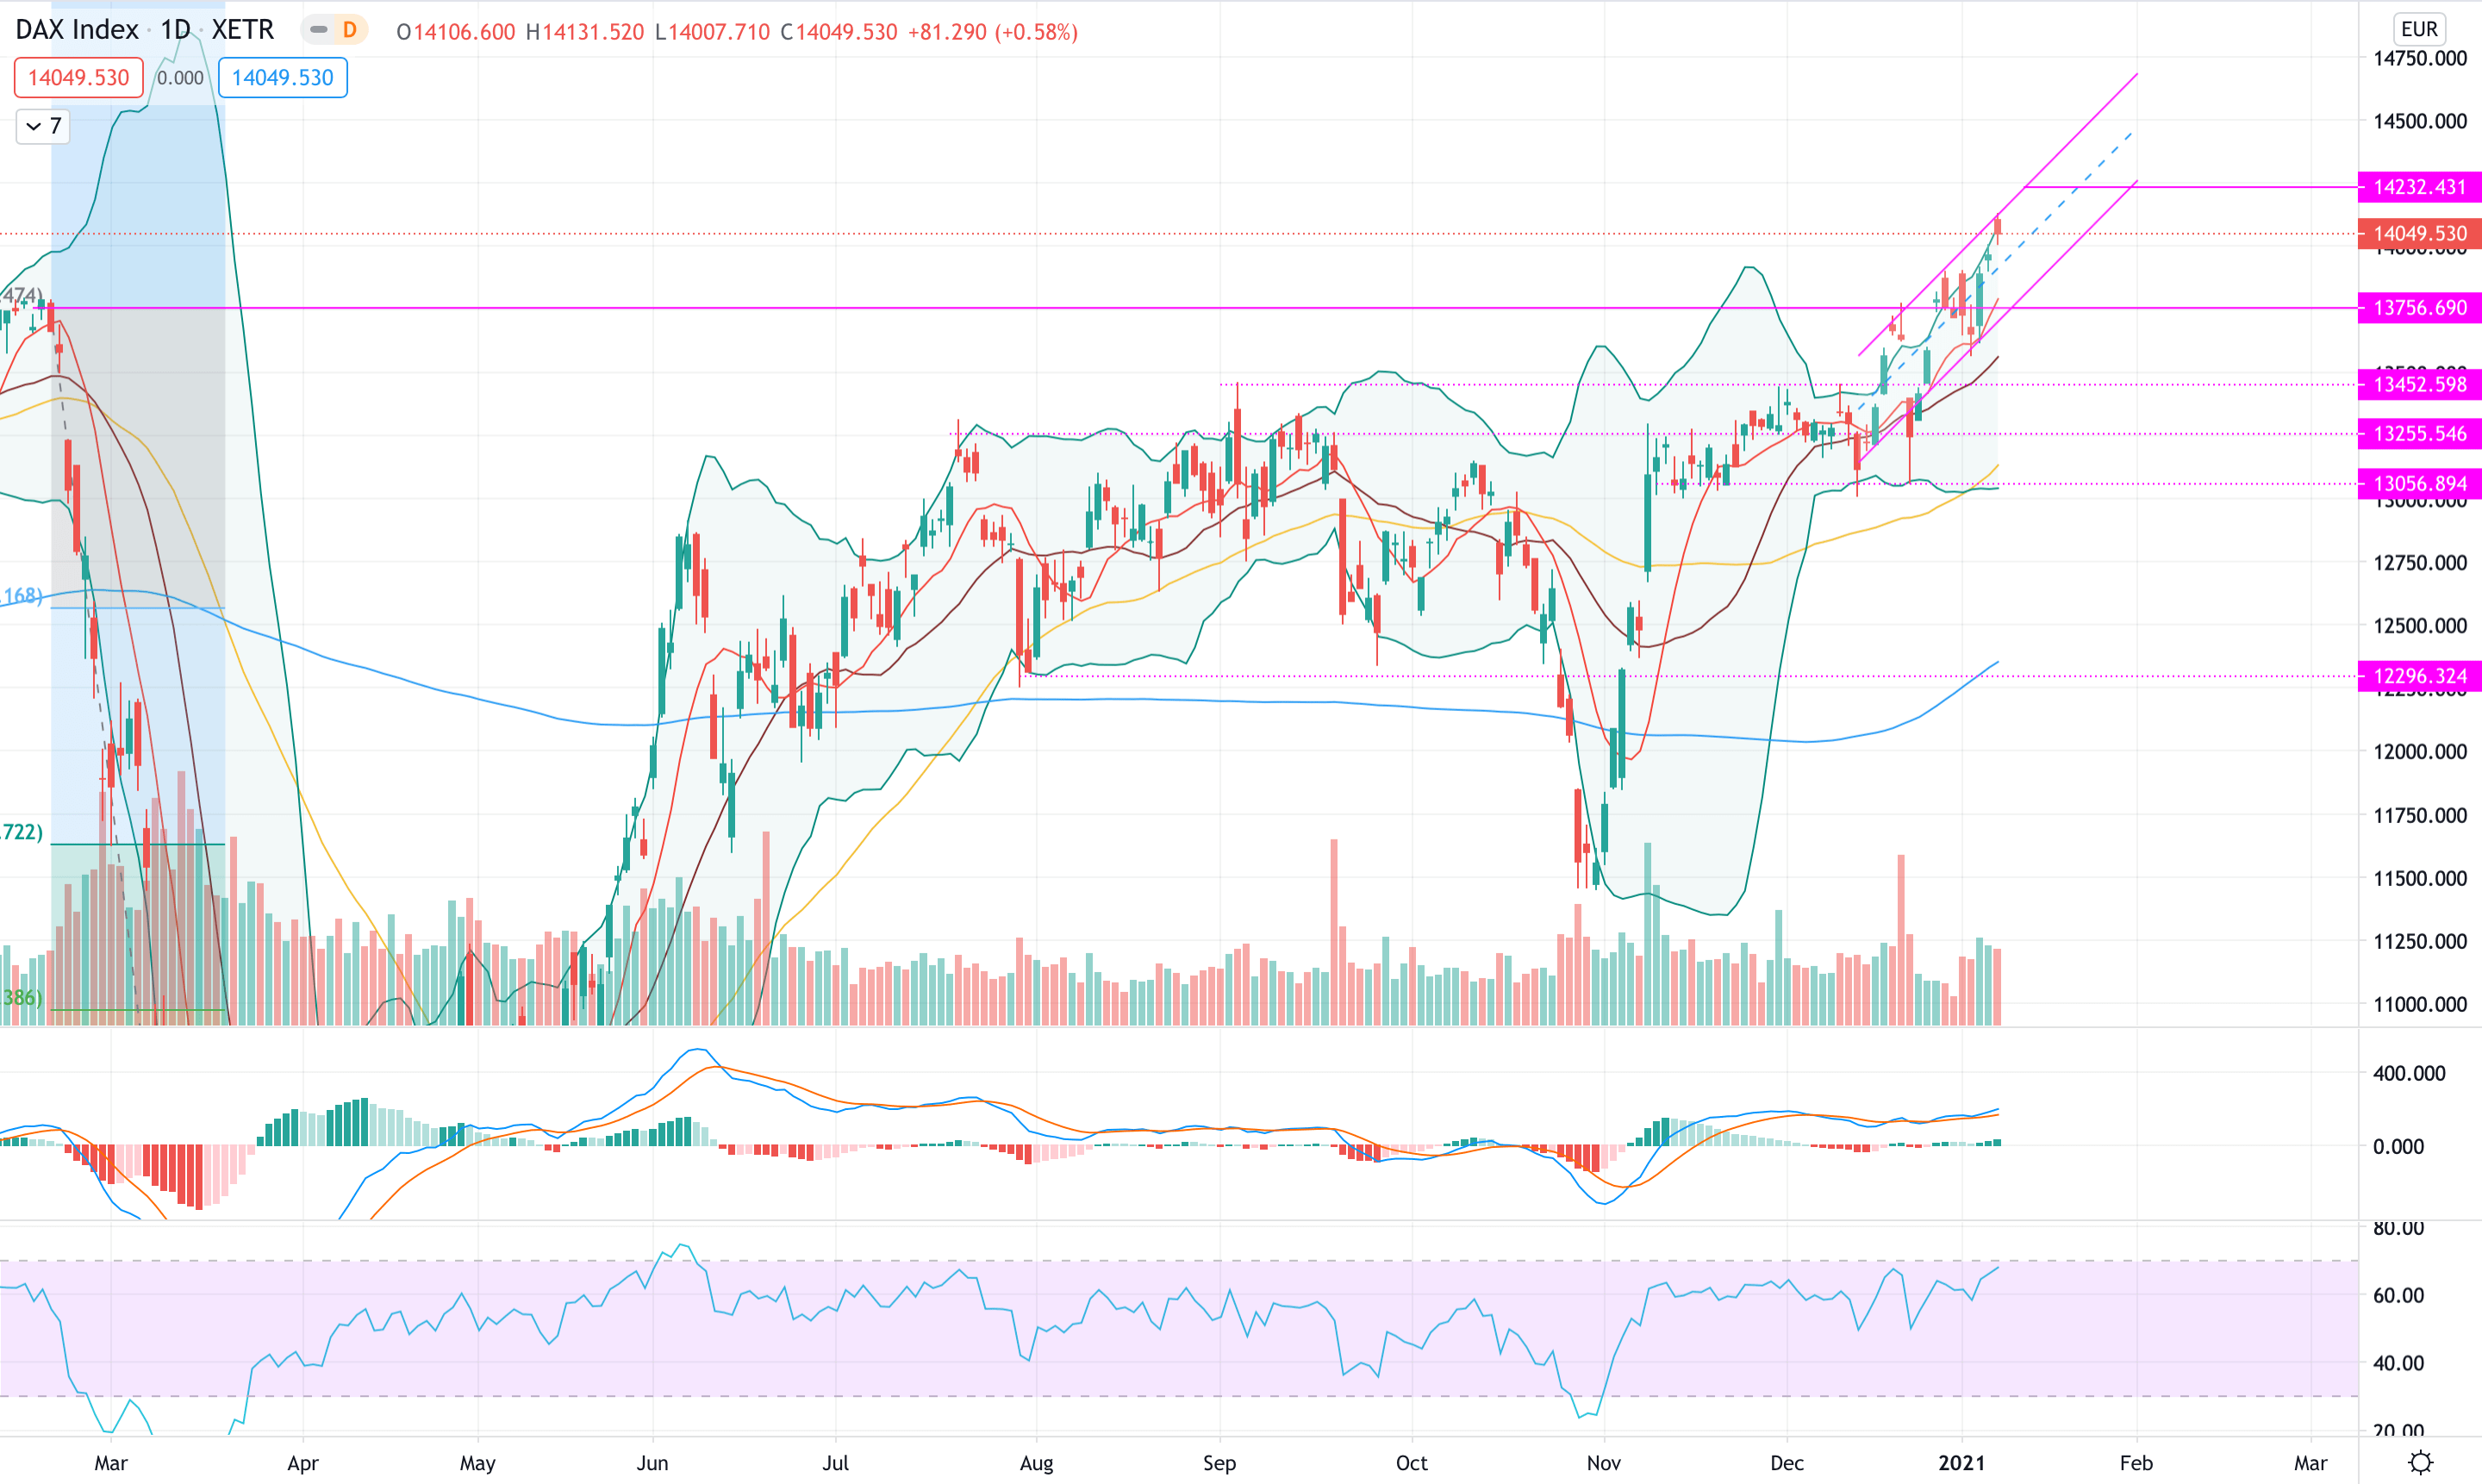
DAX (#DAX)
The #DAX had a modest bullish week and it’s now trading at all time market high: as highlighted last week, the Index tested the 9MA and bounced back breaking previous resistance level.
The 9MA has been so far a good indicator to understand where the German Index might be heading next: at the moment, the Index is relatively distant from the 9MA, so we expect for the week a sideways moves until the #DAX will closer to the moving average.
From a technical perspective, the upward channel has been forming since the December 2020 confirms the current bullish trend. In addition, the RSI is high but not yet in overbought territory
For the coming week, we believe the #DAX may re-test the 9MA level and continue the upward momentum: however, in case the trend line gets broken we would watch the 13,600 as possible resistance.
An intermediate level to watch for intraday moves is also 13,908.
At present, we see support at 13,756 and resistance at 14,232.
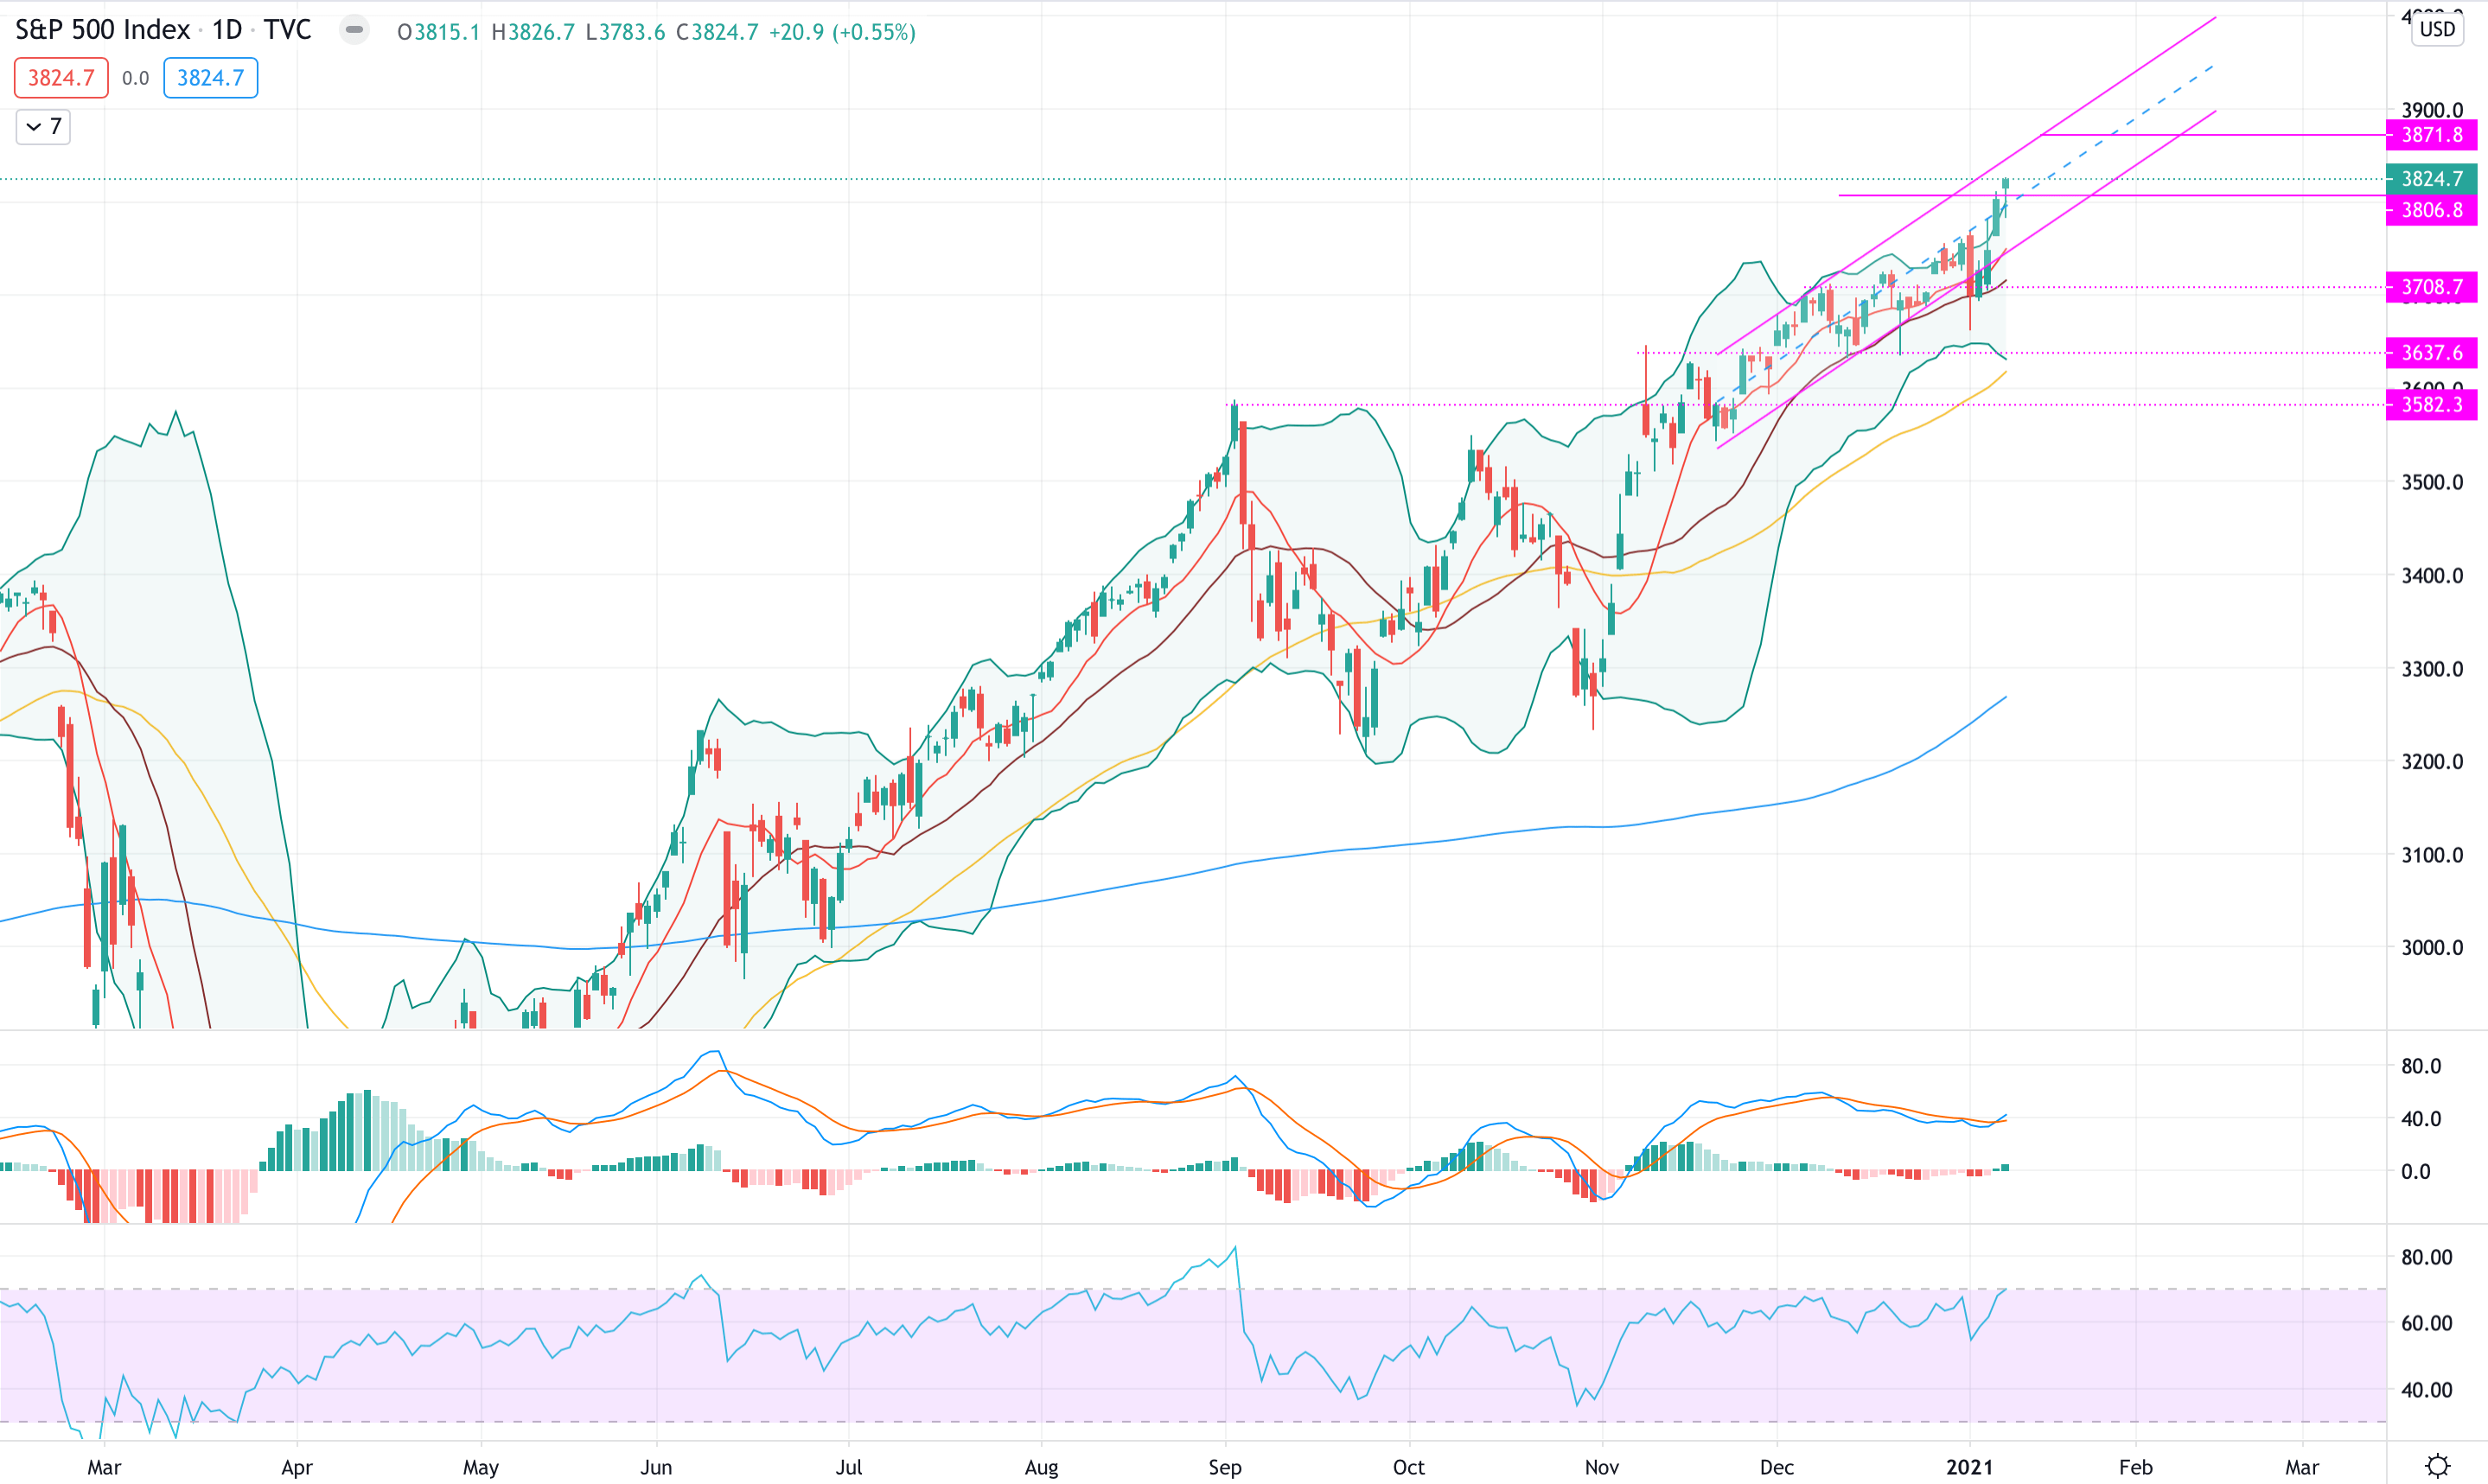
S&P500 (#SPX)
The #SPX had quite a bullish week, up by +1.72% over the last five trading days.
During the week the Index re-tested the 3,708 before entering the the upward channel has been forming since the end of November.
The upward channel confirms the current bullish trend of the Index and the fact that it finished the week with an Hummer candle leading us to think that the trend could continue: in addition, the #SPX is now on the upper hand of the channel which is another positive signal.
From a technical perspective, the MACD has reversed to the upside. On the contrary the RSI is high therefore slight pullbacks are possible.
For the week ahead, we might see a retest of the lower side of the channel before continuing to upside.
In case the trendline gets broken, we will look at the volumes around the 3,708 level to understand the direction.
At present, we see support at 3,806 and resistance at 3,871.
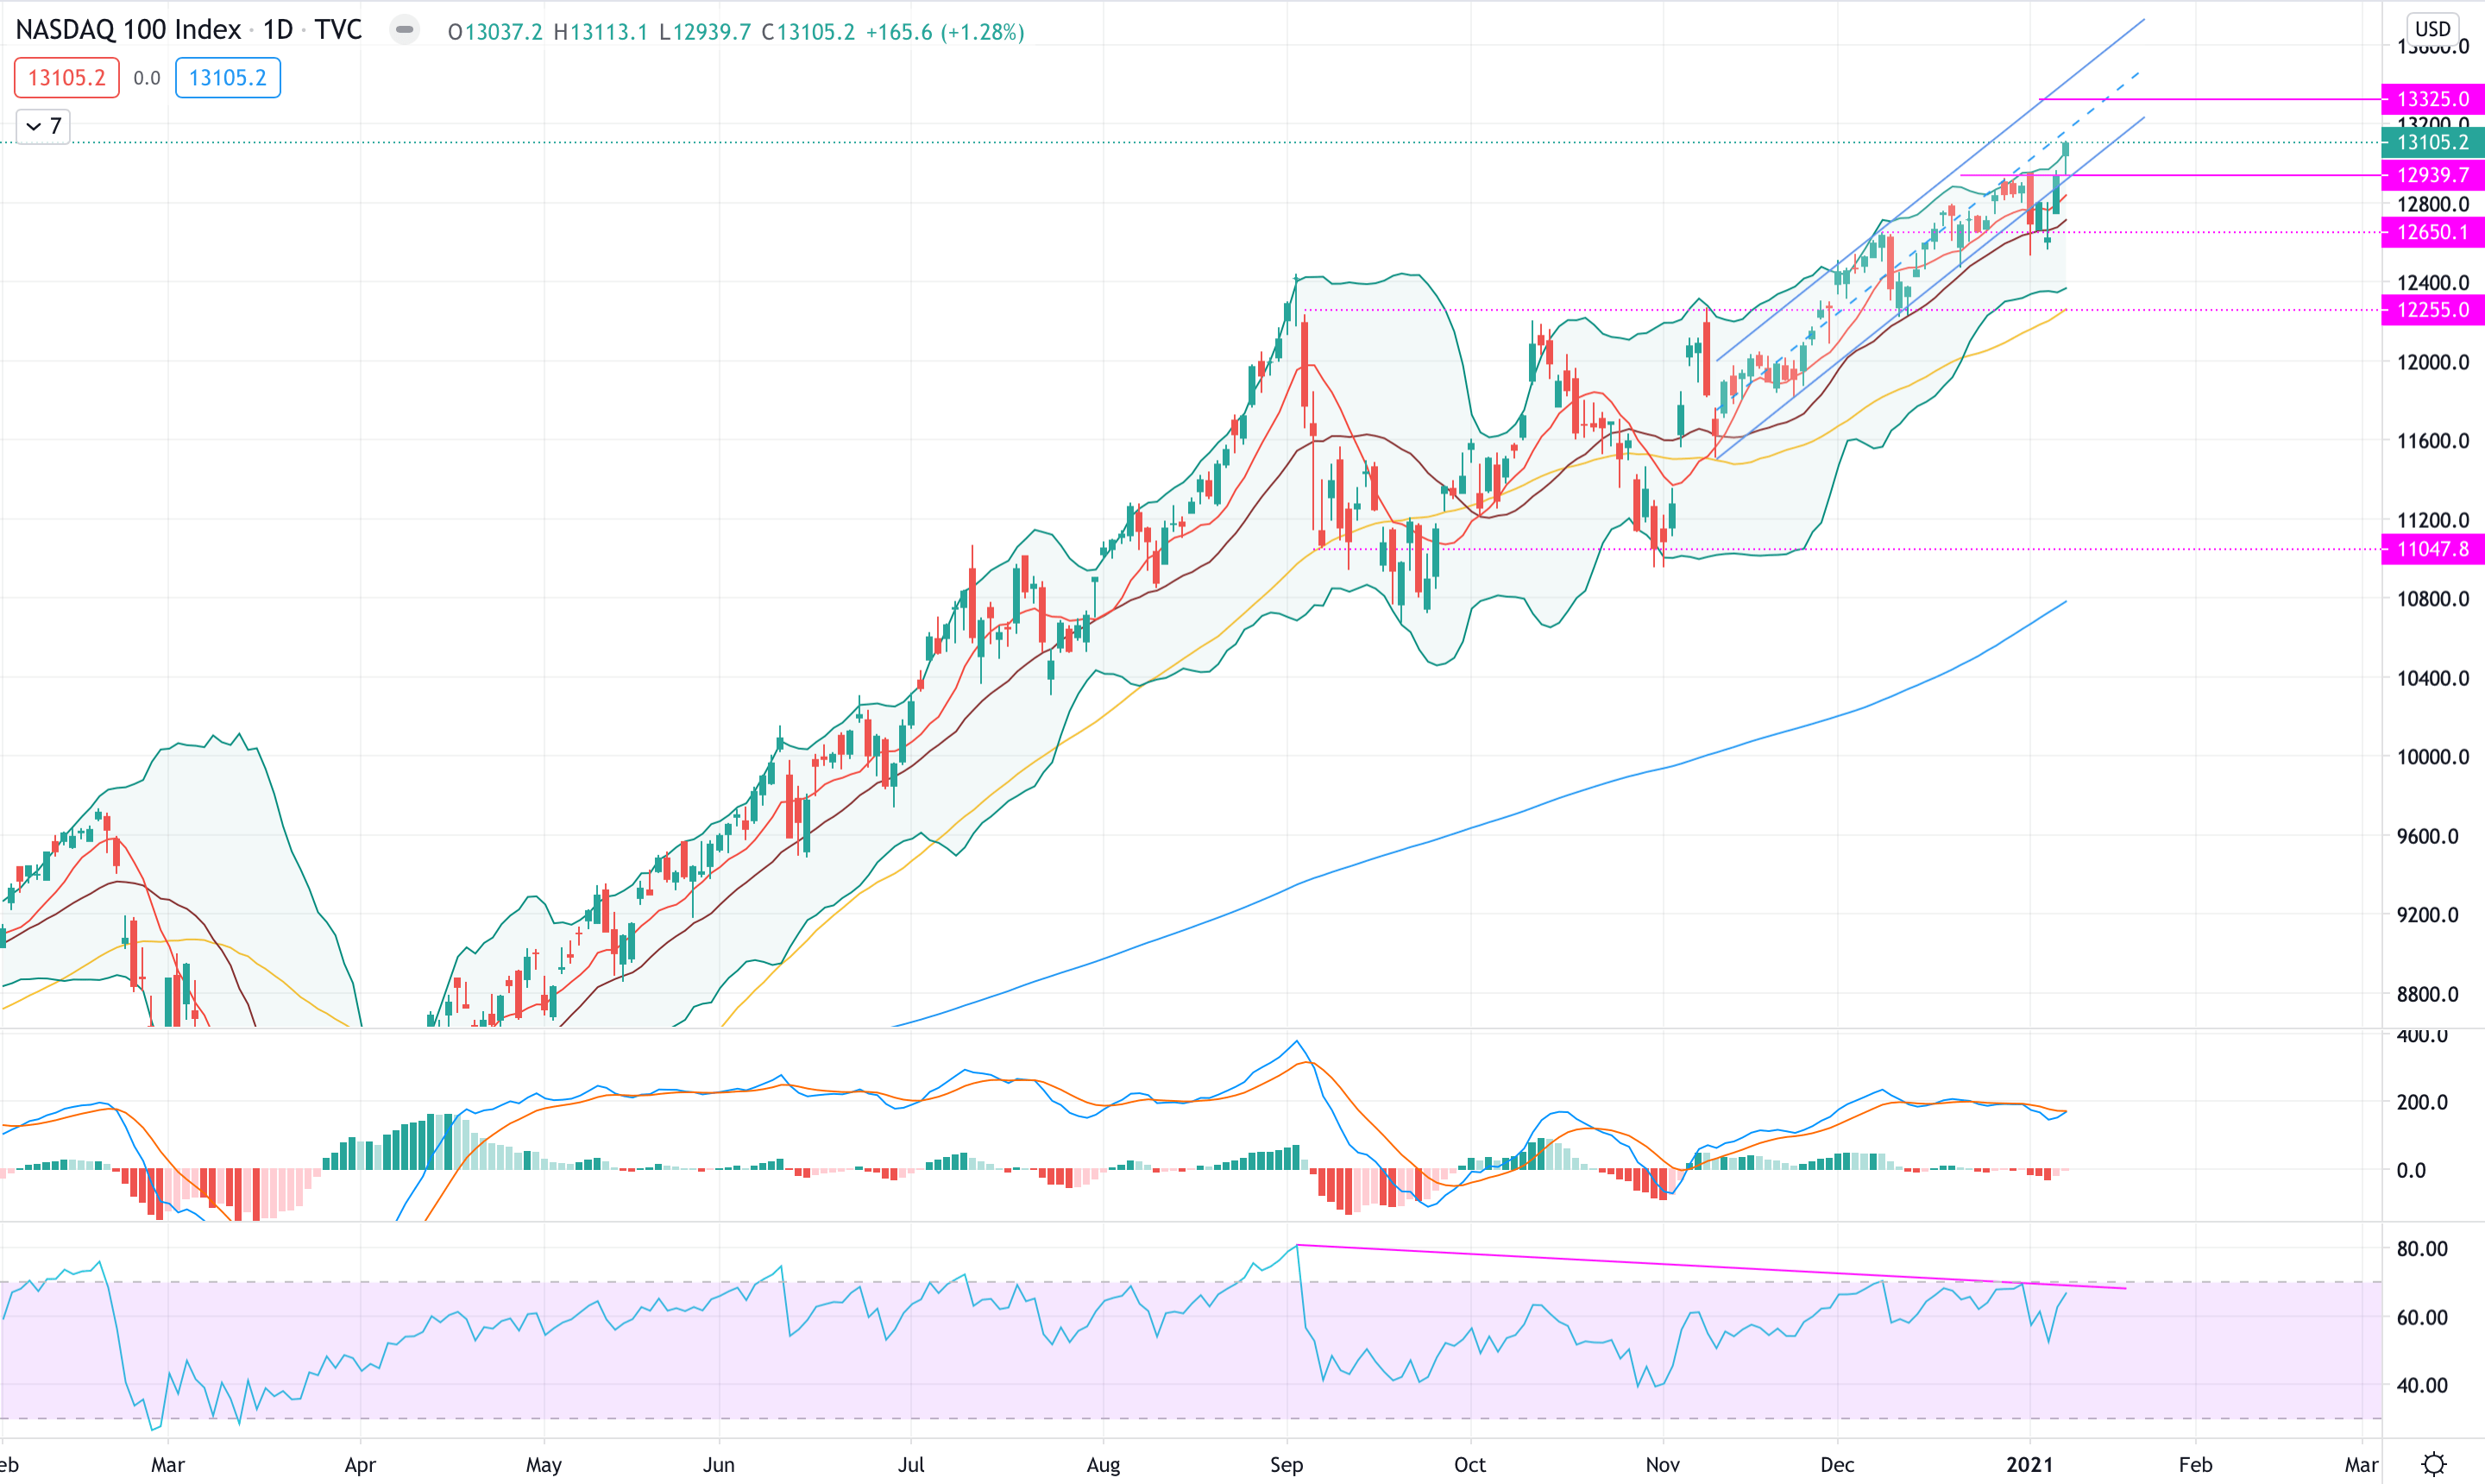
Nasdaq (#NDX)
The #NDX had, like the other major index, a strong performance during the previous week: the previous area of support hold quite tight, it’s in fact there that the reversal candle of 6/01/21 took place and pushed the Index to break previous resistance.
From a technical perspective, given the hammer candle that finished the week, we expect the #NDX to continue to move to the upside for the near future. In addition, the MACD is sloping up giving us reason that the bulls are in control. There will be a slight resistance on passing from the lower to the upper end of the channel at 13,200.
At the same time, the quite high RSI indicates that a possible test of support area is still on the table
At present, we see support at 12,939 and resistance at 13,325.
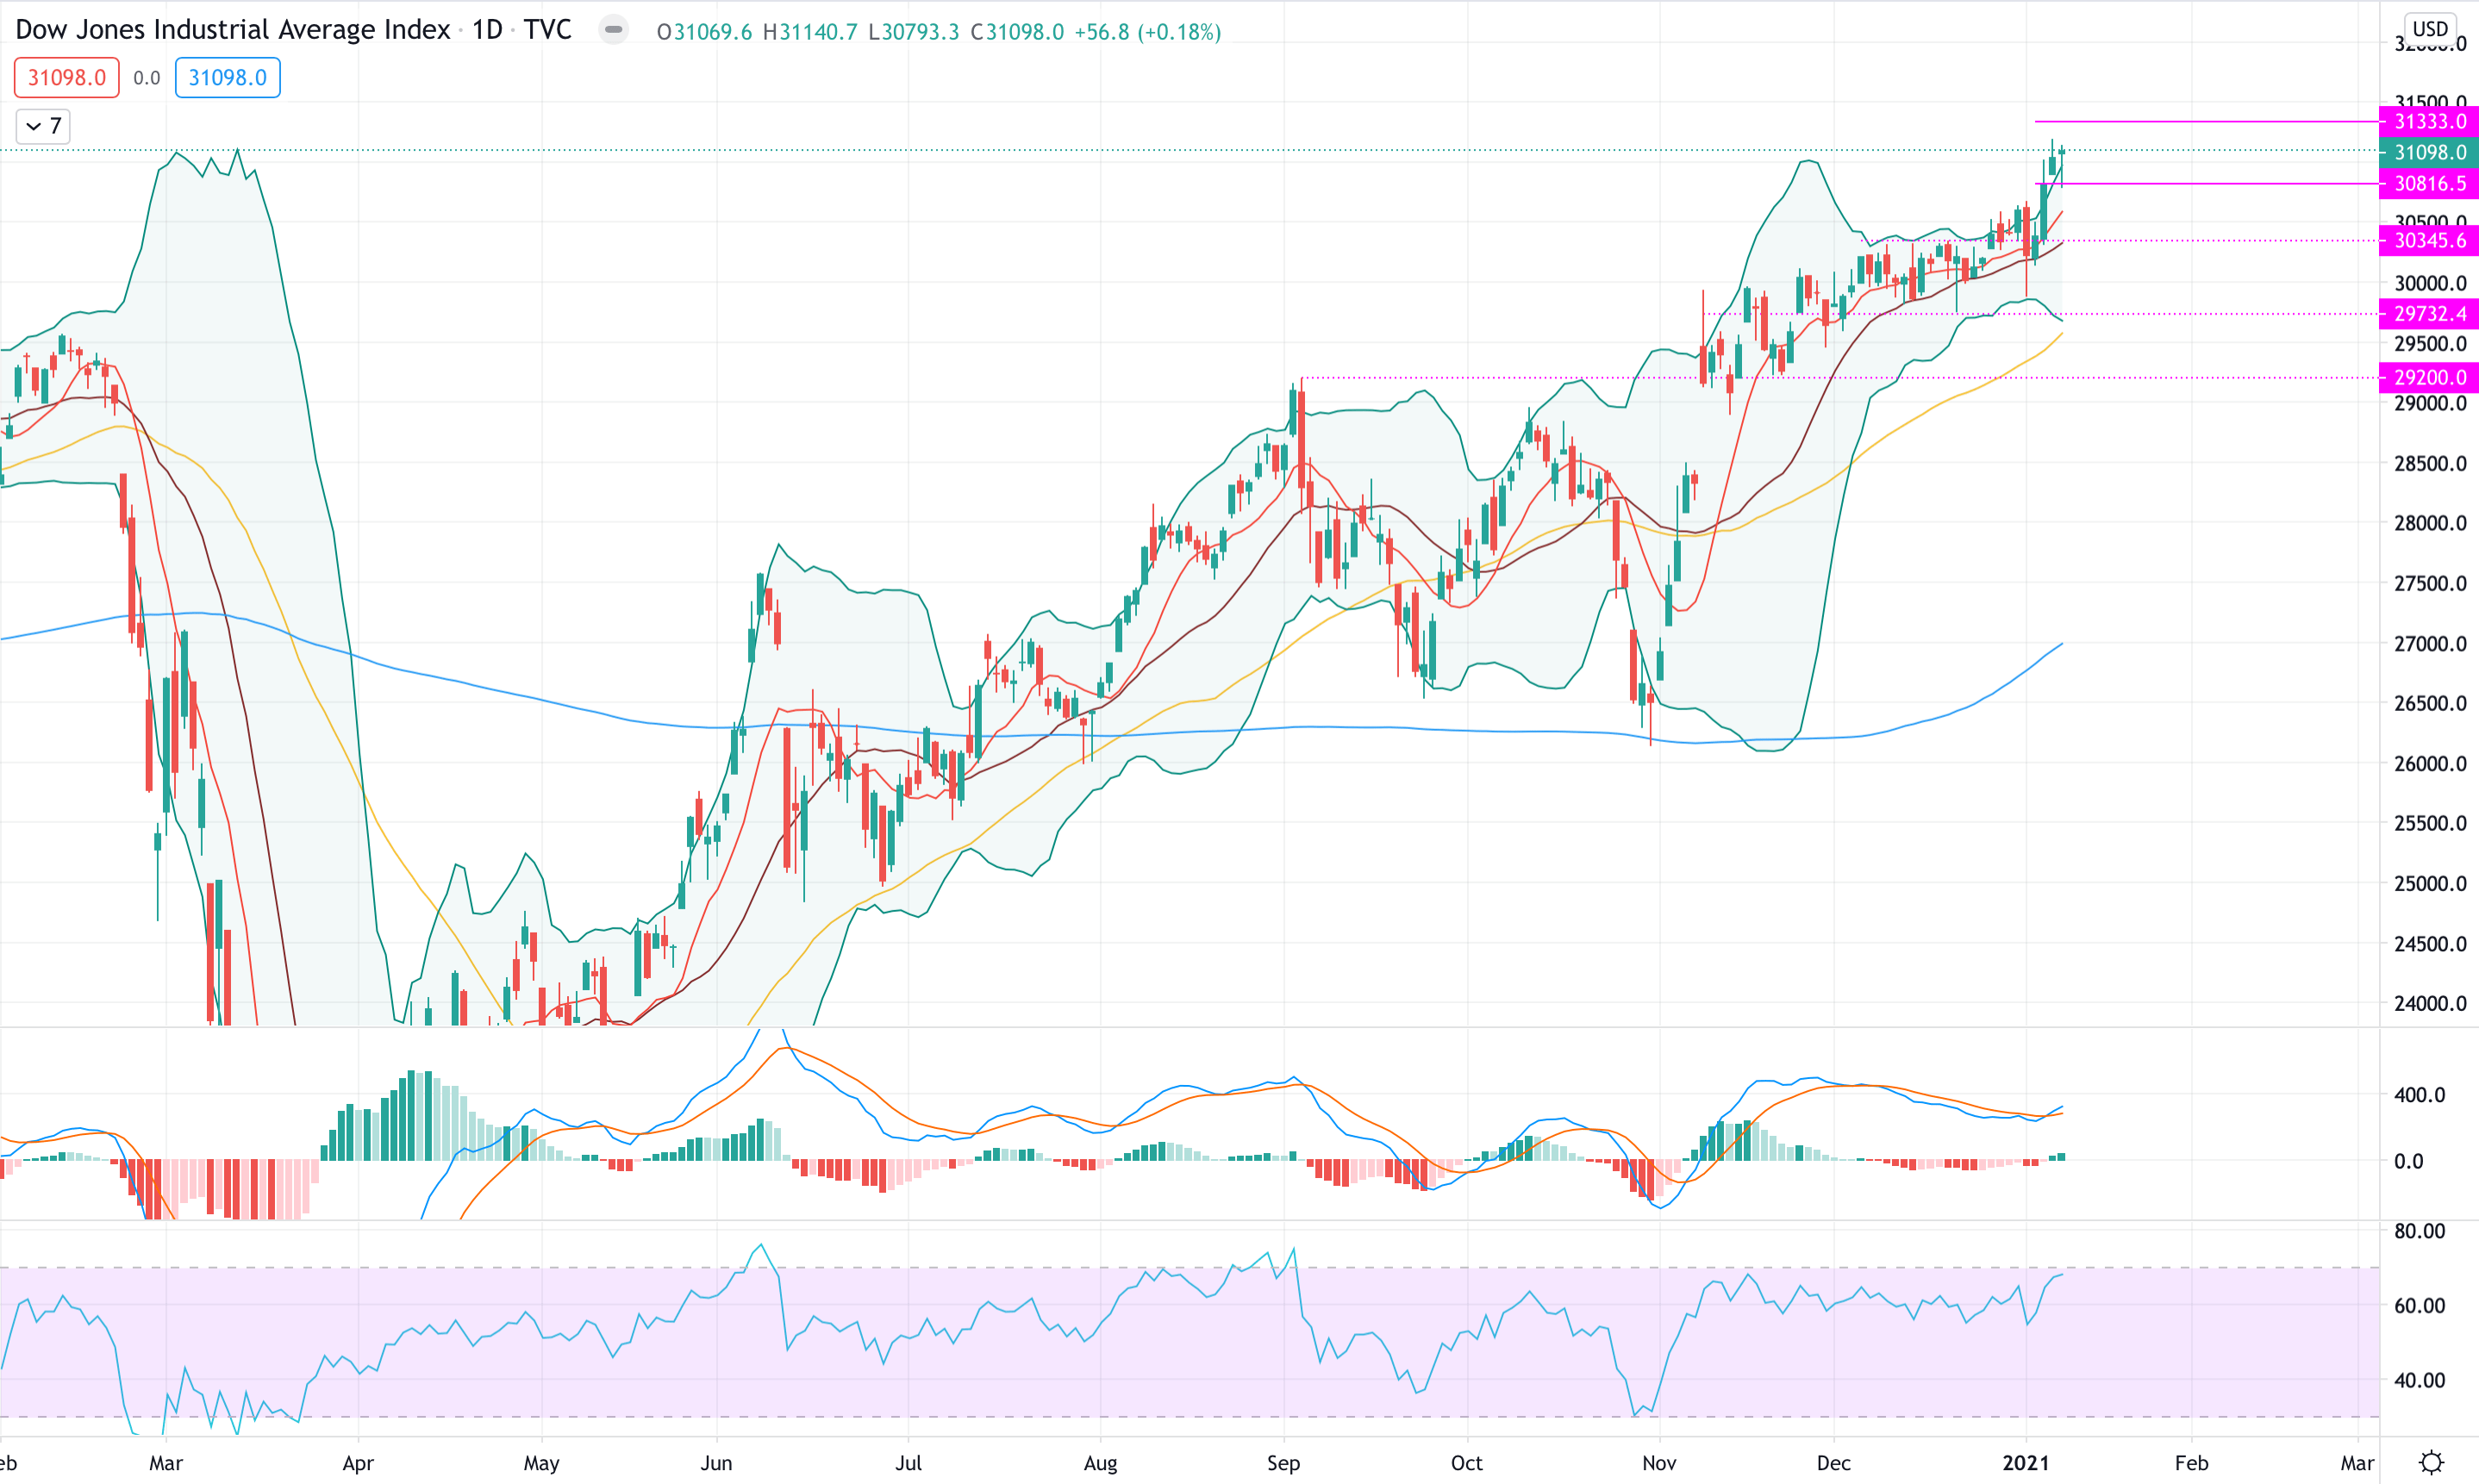
Dow Jones (#DJI)
The #DJI had a positive week by finishing up + 1.69% from last week. As highlighted last week, the Dow continued its bullish trend, re-tested few areas of support and then broke above the resistance level.
From a technical perspective, the MACD has reserved and the momentum is to the upside, on the other side the RSI is approaching overbought territory: therefore, pullbacks might be reasonable in the near future.
Given the last three days candles we might expect, for the coming week, a test of support level at 30,816 before considering any moves in either direction.
At present, we see support at 30,816 and resistance at 31,333.
Author

Francesco Bergamini
OTB Global Investments
Francesco, BSc Finance and Msc in Business Management, graduated with Merit, is a professional with experience in the financial services industry and a keen interest in the financial markets.


