|

Dow Jones Index completes bearish wave C at shallow 38.2% Fib

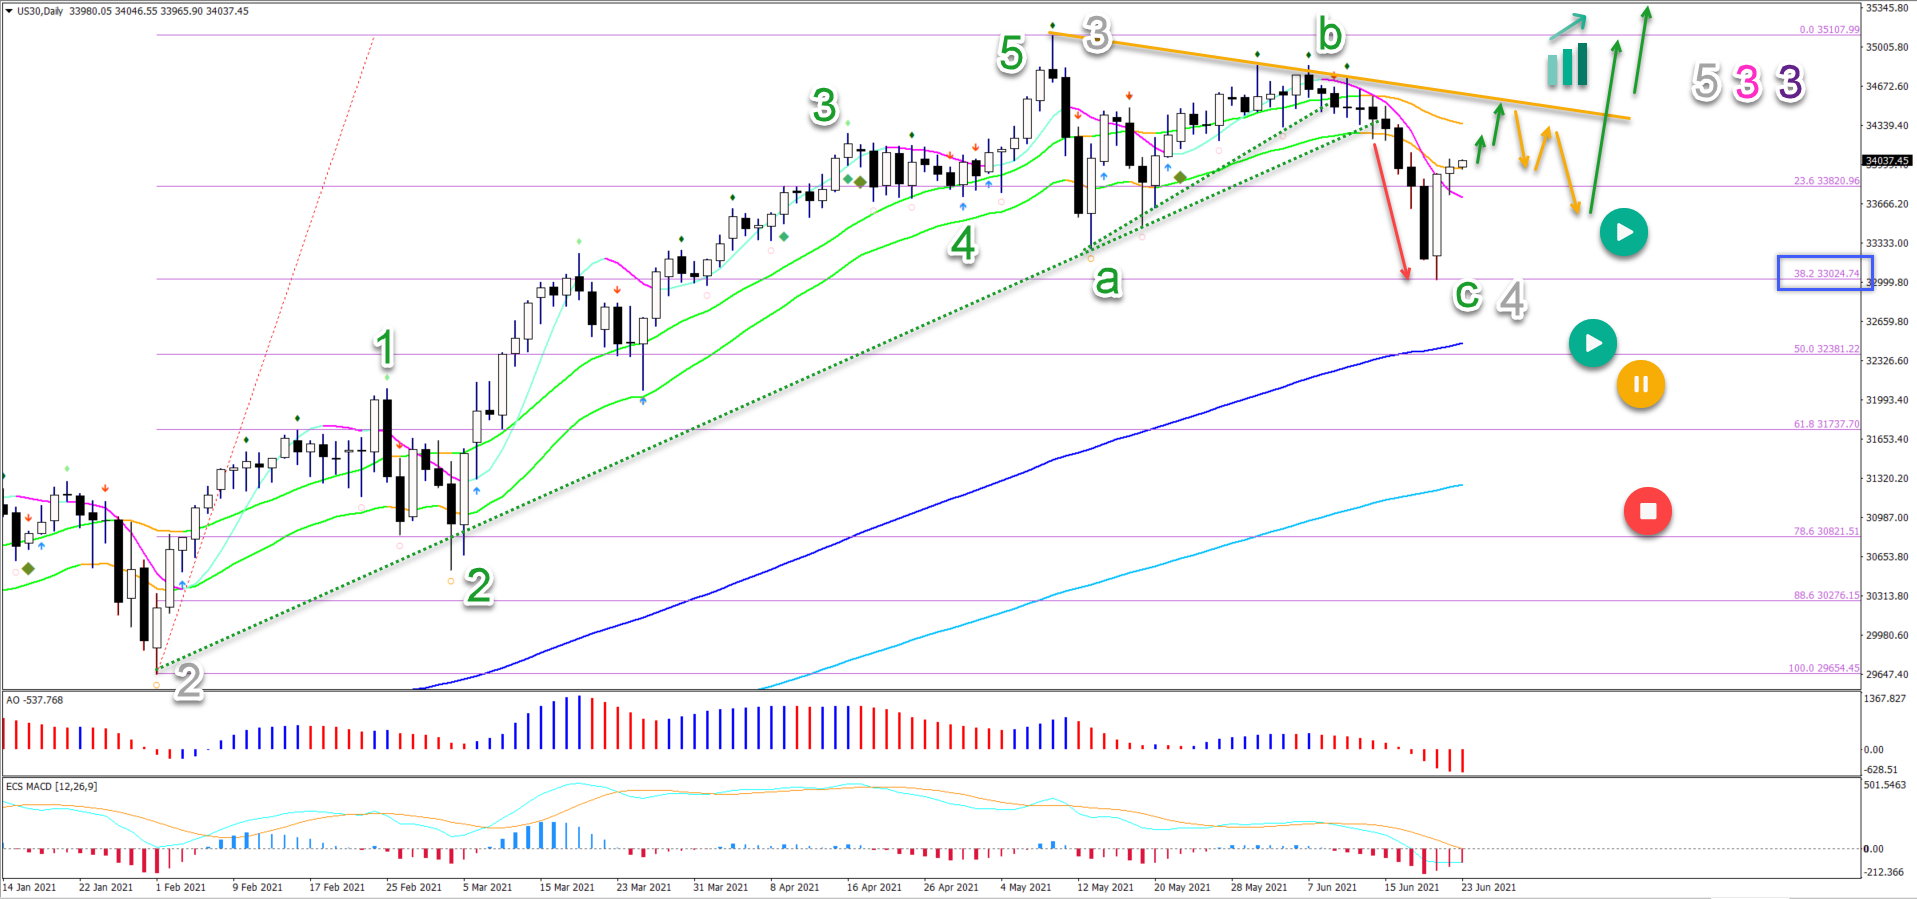
  • US 30 (Dow Jones Index) daily chart made a bearish pullback and bullish bounce at the 38.2% Fib - as expected in our previous Elliott Wave analysis.

  • A strong bullish engulfing twins daily candlestick pattern appeared at the 38.2% Fib. The main target is the -27.2% Fibonacci target at $36,573.

  • A bearish ABC (green) seems to be completed and price action is now testing the 21 ema resistance zone.

This article will analyse whether a wave 4 pattern has been completed at the 38.2% Fibonacci retracement level.

Chart

Price charts and technical analysis

The Dow Jones Index (DJI) broke below (red arrow) the 21 ema low and support trend line (dotted green) for a bearish price swing and a wave C (green):

  1. The bearish price swing bounced at the 38.2% Fibonacci retracement level (blue box), which is typical for a wave 4 (grey) pattern.

  2. A strong bullish engulfing twins daily candlestick pattern appeared at the 38.2% Fib.

  3. A bearish ABC (green) seems to be completed and price action is now testing the 21 ema resistance zone.

  4. A bullish breakout above the resistance trend line (orange) could confirm the uptrend.

  5. A bullish bounce at the 50% is still usual for a wave 4 but a pullback (orange circle) below the 50% Fib places it hold and a deep retracement invalidates it (red circle).

  6. The main target is the -27.2% Fibonacci target at $36,573.

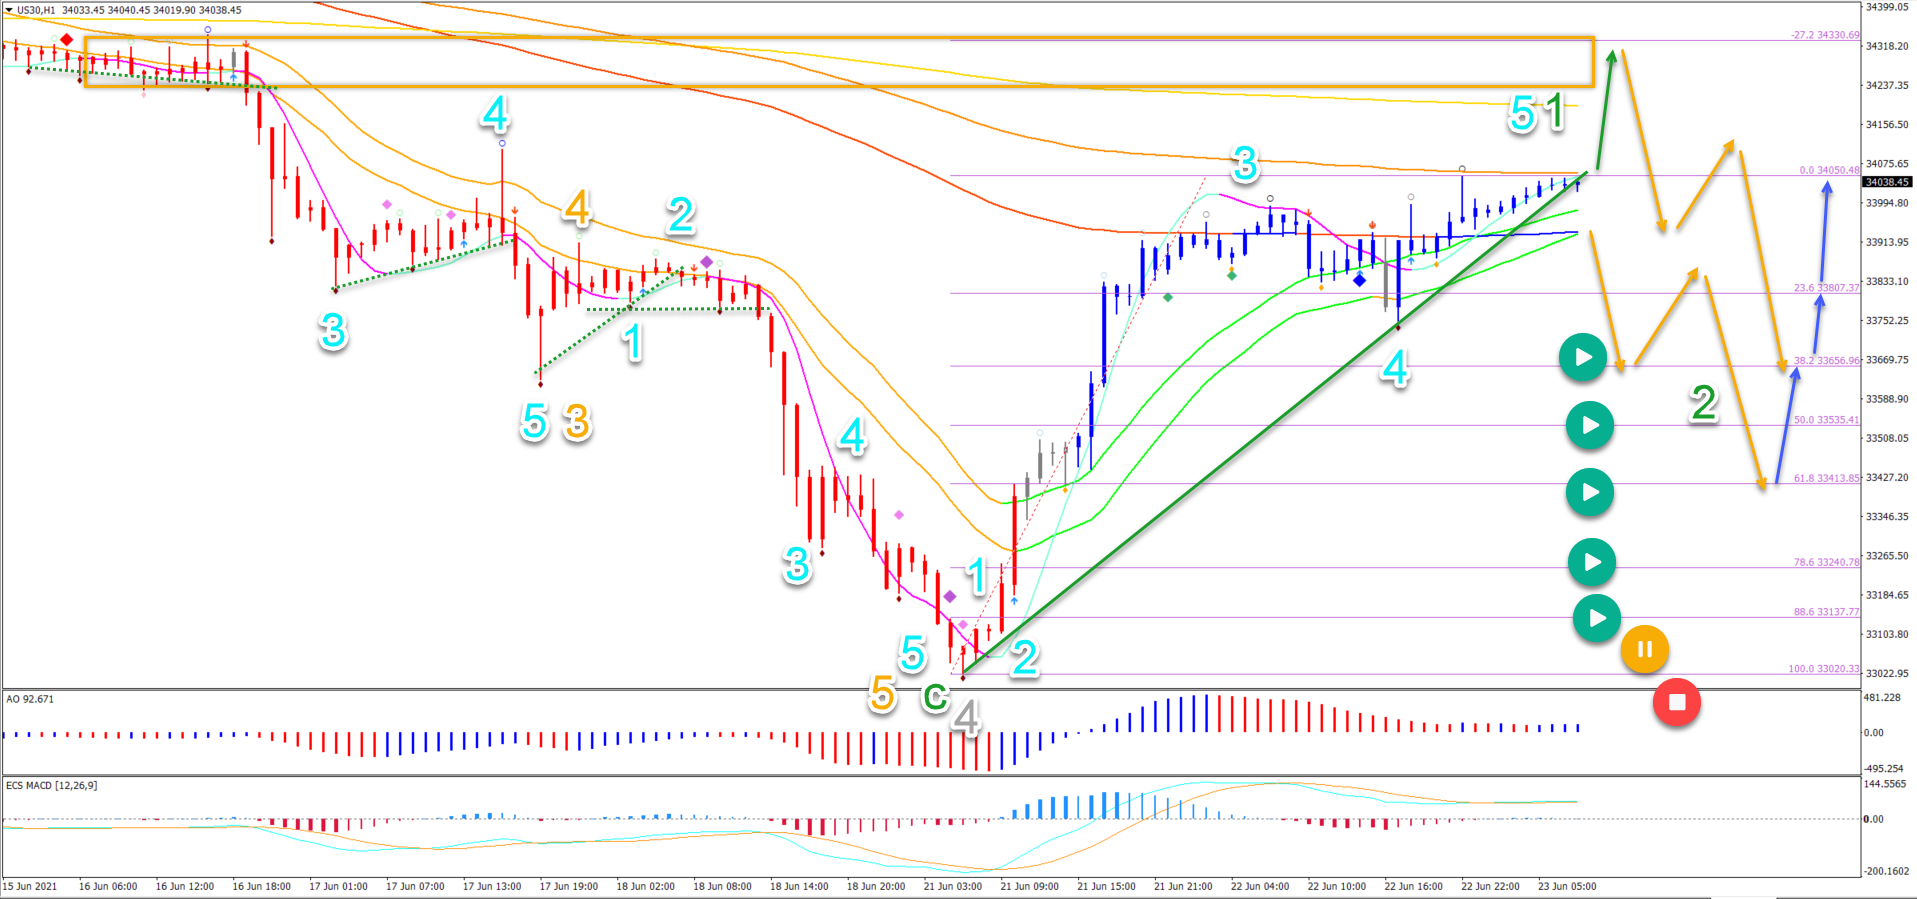
On the 1 hour chart, price action completed a bearish 5 waves (blue) in wave 5 (orange) of wave C (green):

  1. Now price action seems to be building 5 bullish waves (blue) in wave 1 (green).

  2. A bearish break (orange arrows) below the 21 ema low could confirm a bearish ABC in wave 2 (green).

  3. A bullish break (green arrows) could see price action test the resistance zone (orange box).

  4. A bullish bounce is expected (blue arrows) at any of the Fibonacci support levels within wave 2 (green).

Chart

The analysis has been done with the ecs.SWAT method and ebook.

Author

Chris Svorcik

Chris Svorcik

Elite CurrenSea

Experience Chris Svorcik has co-founded Elite CurrenSea in 2014 together with Nenad Kerkez, aka Tarantula FX. Chris is a technical analyst, wave analyst, trader, writer, educator, webinar speaker, and seminar speaker of the financial markets.

More from Chris Svorcik
Share:

Editor's Picks

EUR/USD holds losses near 1.1850 as US, China holidays keep trade muted

EUR/USD opens the week on a softer note, trading near 1.1860 during the Asian session on Monday. Activity is likely to remain muted, with United States markets closed for the Presidents’ Day holiday, while Mainland China is also shut for the week-long Lunar New Year break.

GBP/USD flat lines as traders await key UK macro data and FOMC minutes

The GBP/USD pair kicks off a new week on a subdued note and oscillates in a narrow range, just below mid-1.3600s, during the Asian session. Moreover, the mixed fundamental backdrop warrants some caution for aggressive traders as the market focus now shifts to this week's important releases from the UK and the US.

Gold remains below $5,050 despite Fed rate cut bets, uncertain geopolitical tensions

Gold edges lower after registering over 2% gains in the previous session, trading around $5,030 per troy ounce during the Asian hours on Monday. However, the non-interest-bearing Gold could further gain ground following softer January Consumer Price Index figures, which reinforced expectations that the Federal Reserve could cut rates later this year.

Top Crypto Losers: Dogecoin, Zcash, Bonk – Meme and Privacy coins under pressure

Meme coins such as Dogecoin and Bonk, alongside the privacy coin Zcash (ZEC), are leading the broader market losses over the last 24 hours. DOGE, ZEC, and BONK ended their three consecutive days of recovery with a sudden decline on Sunday, as crucial resistance levels capped the gains. Technically, the altcoins show downside risk, starting the week under pressure.

Global inflation watch: Signs of cooling services inflation

Realized inflation landed close to expectations in January, as negative base effects weighed on the annual rates. Remaining sticky inflation is largely explained by services, while tariff-driven goods inflation remains limited even in the US.

Ripple Price Forecast: XRP potential bottom could be in sight

Ripple edges up above the intraday low of $1.35 at the time of writing on Friday amid mixed price actions across the crypto market. The remittance token failed to hold support at $1.40 the previous day, reflecting risk-off sentiment amid a decline in retail and institutional sentiment.