Dow Jones futures drop: BOE meeting and US jobless claims in focus
Dow Jones Futures Today
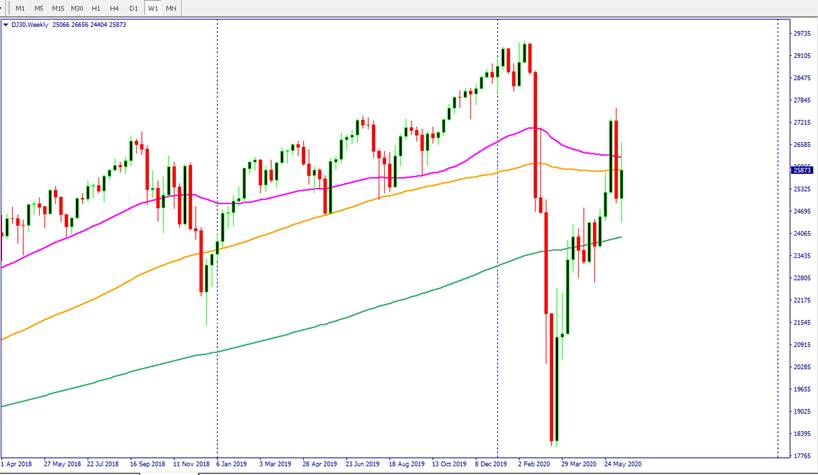
The Dow Jones futures are trading lower by 132 points. The bulls are losing control of the price because the Dow Jones Industrial average has failed to cross above the 200-day smooth moving average (SMA) on a daily time frame. The longer-term time frame, the weekly chart, also shows that the Dow price has failed to win the war against the 50 and 100-week SMAs. If the Dow Jones price fails to cross above the two important moving averages and the Dow remains below them, the door is likely to be wide open for another test of Covid-19’s stock market crash.
The SP500 futures also show signs of weakness and trading lower by 21 points. The week that started with a lot of optimism and hope has lost its mojo. The S&P 500 stock index is still trading above the 200-day SMA on a daily time frame and it is showing a lot better bull strength than the Dow Jones Index.
The below chart shows the Dow Jones price today and its price action with respect to major moving average.
Stock Market Rally
The Federal Reserve’s chairman, Jerome Powell confirmed once again yesterday in his testimony that certain jobs such as hospitality may not come back quickly. Hence workers in those sectors may need some more help. This echoes the same message that Democrats have been using in order to get more fiscal help. He urged the policymakers to extend the extra $600 in weekly unemployment benefit because, in the absence of this, it could create more damage. The Fed chairman was optimistic about the current recovery and he believes that things are likely to get better than many are anticipating.
The SP500 index declined by 11.25 points or -0.36% and the Dow Jones stocks dropped 170 points or -0.66%. Both, the S&p 500 and the Dow stocks swung between losses and gains throughout the session but it was the energy sector that took most of the beating. Real estate and financial sectors also lead the losses. Stock volume was also 20% below the 30-day average and we continue to see higher volatility. It is highly likely that this surge in volatility may stay here for a little while.
The NASDAQ index was the champion again. The NASDAQ stocks aided the index to close the day with a gain of 0.33%.
Stock Market Breadth
Measuring the market breadth is an important function as it provides a lot more detail about the strength of the stock market rally and it also helps traders to filter out the noise.
The S&P stocks breadth
-
26% stocks trading above the 10-day smooth moving average- difference from yesterday +16%
-
87% stocks trading above the 50-day smooth moving average- difference from yesterday +5%
-
42% stocks trading above the 200-day smooth moving average- difference from yesterday +3%
The Dow Jones stocks breadth
-
10% stocks trading above the 10-day smooth moving average- difference from yesterday +6%
-
83% stocks trading above the 50-day smooth moving average- difference from yesterday +16%
-
30% stocks trading above the 200-day smooth moving average- difference from yesterday +0%
The NASDAQ stocks breadth
-
41% stocks trading above the 100-day smooth moving average-difference from yesterday +5%
-
77% stocks trading above the 50-day smooth moving average-difference from yesterday -1%
-
41% stocks trading above the 200-day smooth moving average- difference from yesterday +2%
Bottom line: Further shift in bullish momentum as more stocks have moved their 200-day smooth average.
Ahead Today
The Bank of England decided on its monetary policy, it is widely expected that the bank is going to leave the interest rate unchanged and strike an ultra dovish tone because of coronavirus and Brexit. We also have the weekly US jobless claims data and any improvement in that is likely to bolster the risk sentiment among investors.
Author

Naeem Aslam
Zaye Capital Markets
Based in London, Naeem Aslam is the co-founder of CompareBroker.io and is well-known on financial TV with regular contributions on Bloomberg, CNBC, BBC, Fox Business, France24, Sky News, Al Jazeera and many other tier-one media across the globe.


