Dollar under pressure as the game of relatives turns around

Market Overview
The dollar is coming under pressure as markets reprice for the relative performance of other forex major currencies. Comments from central bankers in recent days suggest that perhaps it will not be too long before the Fed is joined by other central banks in tightening monetary policy. In recent days there have been hawkish indications from the ECB’s Draghi, the Bank of England’s Carney and Bank of Canada’s Poloz, all of which have signalled a potential end to their easing programs could be close. Playing currencies is a game of relatives and with traders questioning the Fed’s ability to tighten in light of subdued inflation, the dollar is under pressure. Even in the face of rising Treasury yields and the 2s/10s spread pulling higher, the dollar is suffering as other major currencies have strengthened significantly. It would appear that only the yen, with the BoJ remaining committed to easy policy, remains subdued against the dollar. Equities have picked up as US banks have been given the green light in stress tests to increase dividend and share buybacks. This is rolling into Asian and European sessions.

Wall Street closed strongly with the S&P 500 +0.9% at 2441, whilst the Nikkei was+0.4% and European markets are stronger in early moves. Forex majors show the US dollar under pressure once more across the board with the euro and sterling both strong, although the yen remains a notable underperformer. In commodities, gold is mildly higher, whilst oil is looking to continue its run of positive sessions with a further half a percent today.
German inflation will dominate the early European session. The regional German inflation numbers are released throughout the morning with the countrywide German HICP at 1300BST. Month on month German HICP is expected to be flat (having fallen by -0.2% last month) whilst the year on year is expected to dip back to +1.3% (from +1.4% last month). Then the focus will be on the final reading of US Q1 GDP growth at 1330BST. Last month the Prelim number showed an upward revision to +1.2% and the final reading is expected to be +1.2% again. Weekly Jobless Claims are at 1330BST and are expected to be 241,000 (last week 241,000)
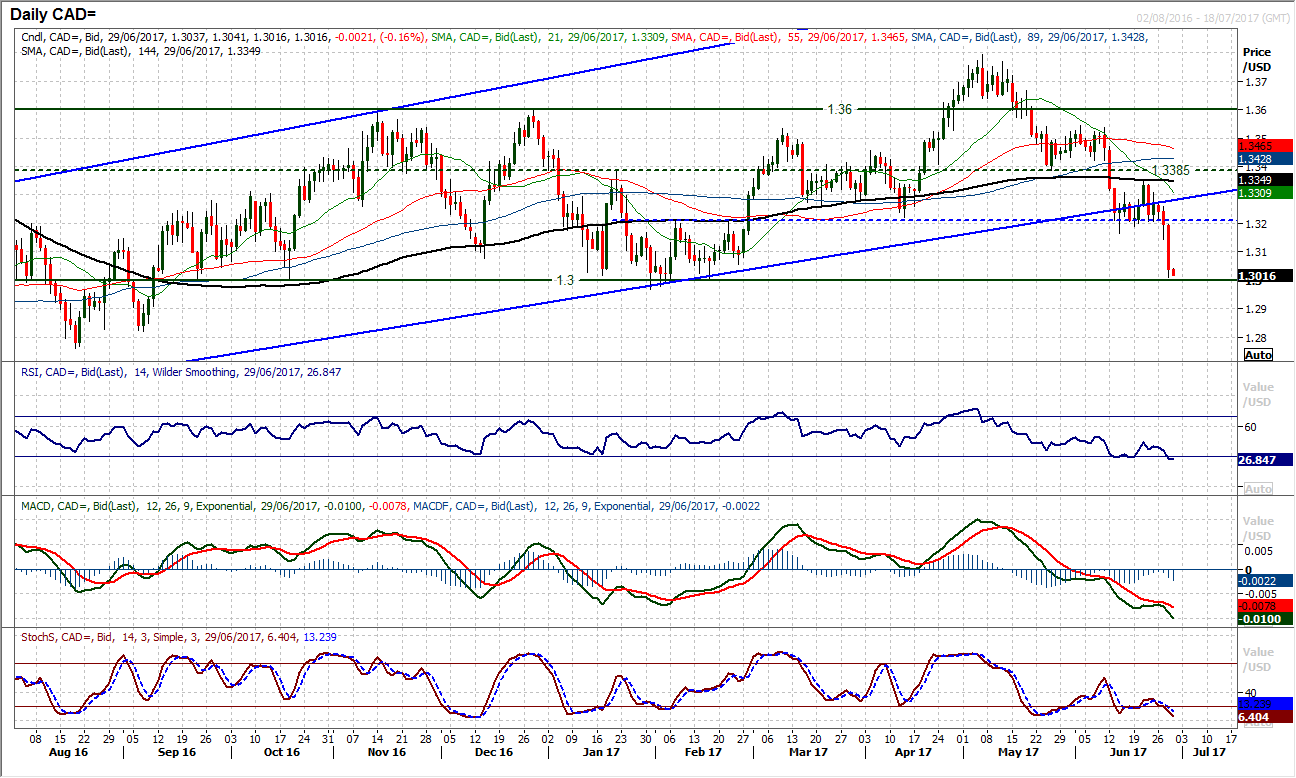
Chart of the Day – USD/CAD
The dollar is under significant pressure and the commodity currencies are also benefitting from the recovery in commodities. With the Canadian dollar this is the recovery in oil, which has helped the sharp fall on USD/CAD. The huge bear candle of well over 1% decline yesterday has opened the key 1.3000 floor once more. Since late September, the 1.3000 level has been a basis of key support on several occasions. Intraday moves have occasionally breached the support (to an absolute low of 1.2967) but no closing breach has been seen. The momentum indicators are very bearishly configured with a bear kiss on the MACD lines and Stochastics falling back below 20. However the RSI closing below 30 is extremely rare and is also a three year low. This means a crucial crossroads has been reached. A close below 1.3000 would be a significant bear signal and could open the floodgates for a test of the September 2016 low (1.2818) and the key August 2016 low (1.2760). However if the support continues to hold then once more there could be another oversold rally. The hourly chart could hold the key with initial resistance 1.3115 before 1.3145/1.3155. The hourly RSI back above 50 would be a signal of burgeoning recovery again, however the early moves this morning do not suggest appetite to buy the US dollar. A crucial moment.
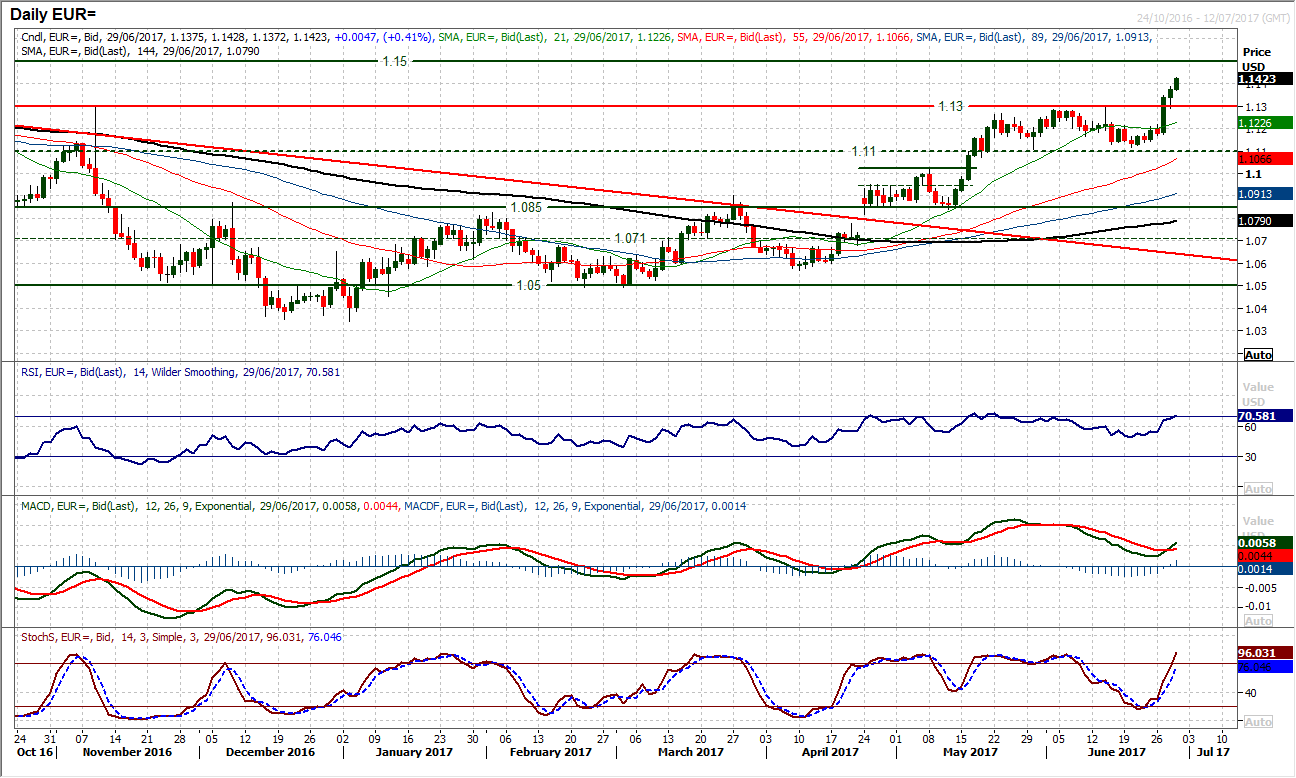
EUR/USD
Despite the insistence from the ECB that the market has “misinterpreted” Mario Draghi on Tuesday as being more hawkish than he intended to sound, the euro continues to make strong gains. The moves in the past two completed sessions have changed the outlook. The strong bull candle that broke above $1.1300 resistance was followed yesterday by another confirmation bull candle. The momentum is increasingly strong with the MACD lines now completing a bull cross whilst Stochastics rise strongly and the RSI pushed higher. It was interesting yesterday to see the euro bouncing from a low at $1.1290, effectively the previous resistance which has subsequently turned supportive, only for the bulls to push higher once more. The medium term base pattern target of $1.1350 has now been achieved and the bulls now have their sight on the next key resistance levels. The June 2016 high (from the day of Brexit) at $1.1432 and then the May 2016 high at $1.1615 are both major resistance levels. The hourly chart shows strong momentum and corrections being bought into. There is minor support initially around $1.1350.
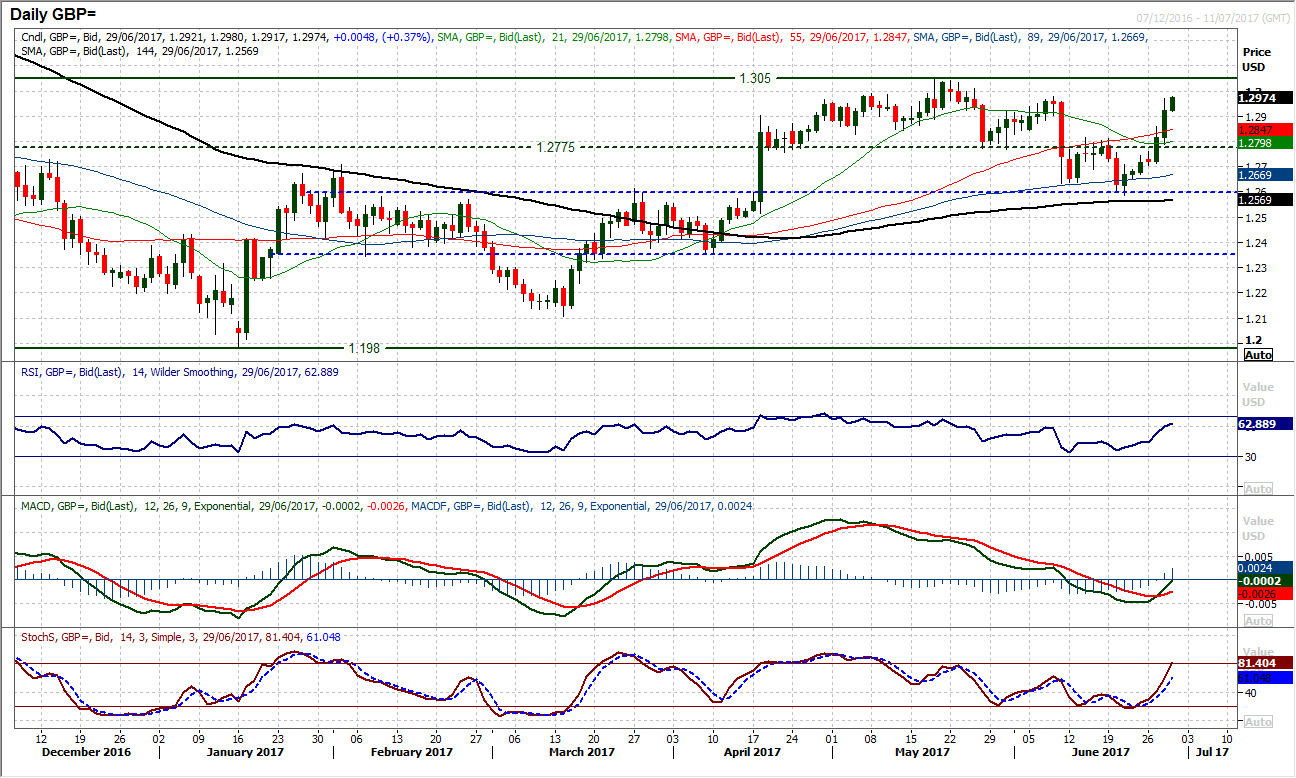
GBP/USD
With the backdrop of a weakening dollar in the past couple of sessions, sterling has significantly strengthened on the suggestion of potentially tighter monetary policy from the Bank of England. The outlook of correction on Cable has subsequently been turned on its head. What had previously been selling into strength has burst through the key resistance at $1.2775 and now the bulls will be positioning for further gains. Momentum has significantly improved with MACD and Stochastics and the RSI back above 60 for a five week high. The old resistance at $1.2775 now becomes a basis of support once more as the pivot is once more a key level to watch. The resistance of the June high at $1.2977 is now ready to be tested as the market looks to continue the run of six consecutive higher closes. The hourly chart shows strong configuration and corrections being bought into, with the initial support at $1.2915.
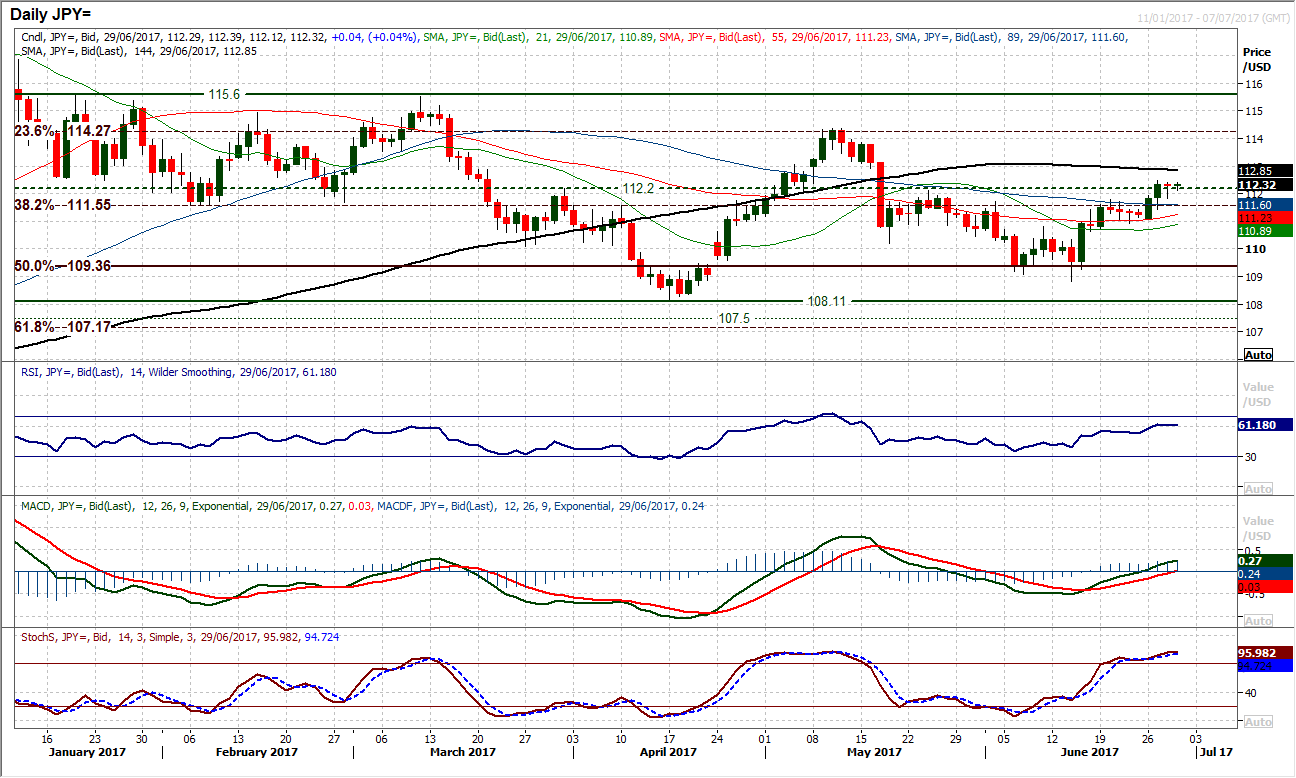
USD/JPY
It is interesting to see that despite the dollar coming under significant selling pressure against the euro and sterling (amongst others), one currency that has been unable to make headway against the greenback is the yen. The dollar has held on to the strong gains earlier in the week and momentum remains positive. This comes with yesterday’s candle threatening a drop back but the bulls defending the breakout above 112.20 old resistance. The break has now yet been decisive though and there is still a degree of uncertainty over the move. However there is consistent pressure to break the shackles of the top of the 111.55/112.20 resistance band and if the market can begin to move decisively clear the bulls will be looking towards the net resistance band 113.00/114.30. Momentum on the hourly chart remains positive with intraday corrections being bought into, so watch for the early dip today to find support again above 111.80 initial support. A move above 112.45 would open the upside.
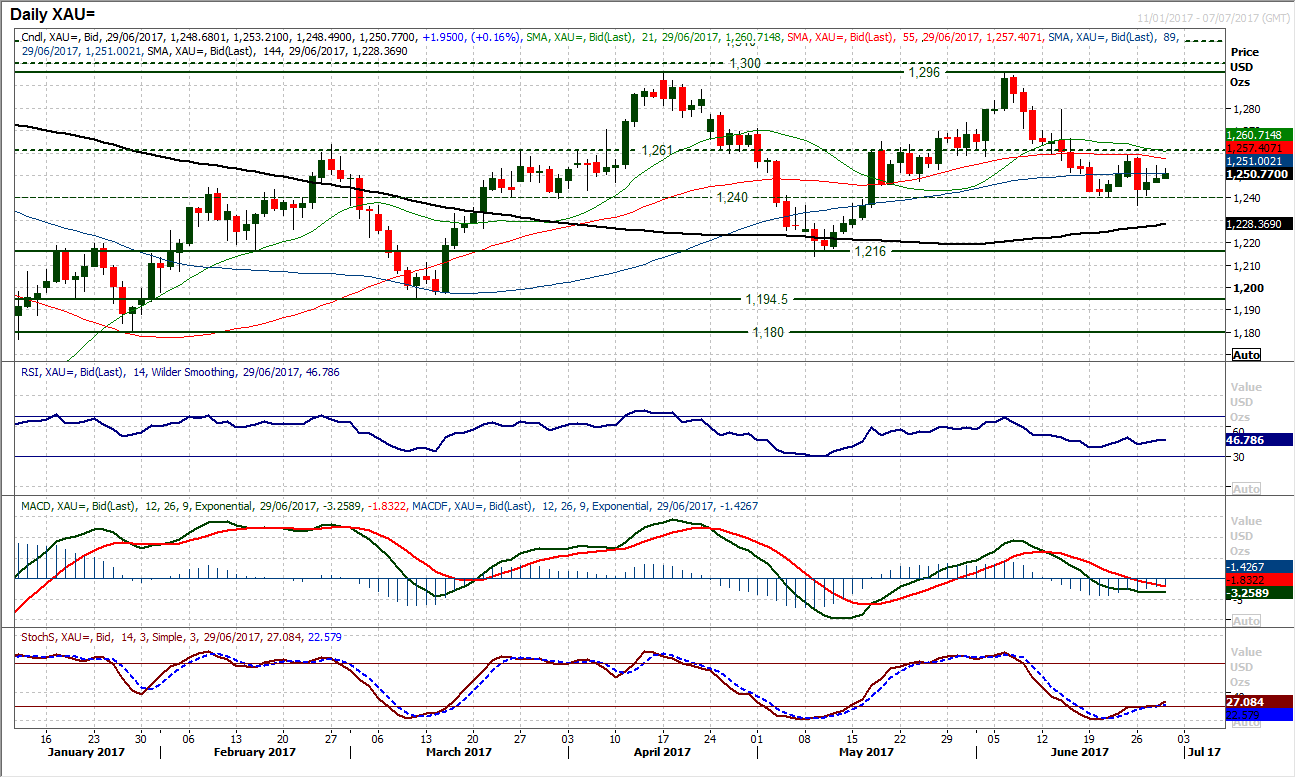
Gold
Gold is in wait and see mode for now. The break below $1261 has held on to the old pivot support around $1240 (barring the brief intraday dip below on Monday’s fat finger trade). The market has subsequently stabilised with a couple of positive closes and a rebound continuation today. A closing break of $1261 or $1240 would therefore be directional for the next move. Momentum is broadly neutral now to reflect this sideways phase of the past couple of weeks and we await the next break. The hourly chart is giving little indication of its direction with moving averages converging around flat. The buying in the past couple of sessions gives the mildest bull bias but nothing decisive.
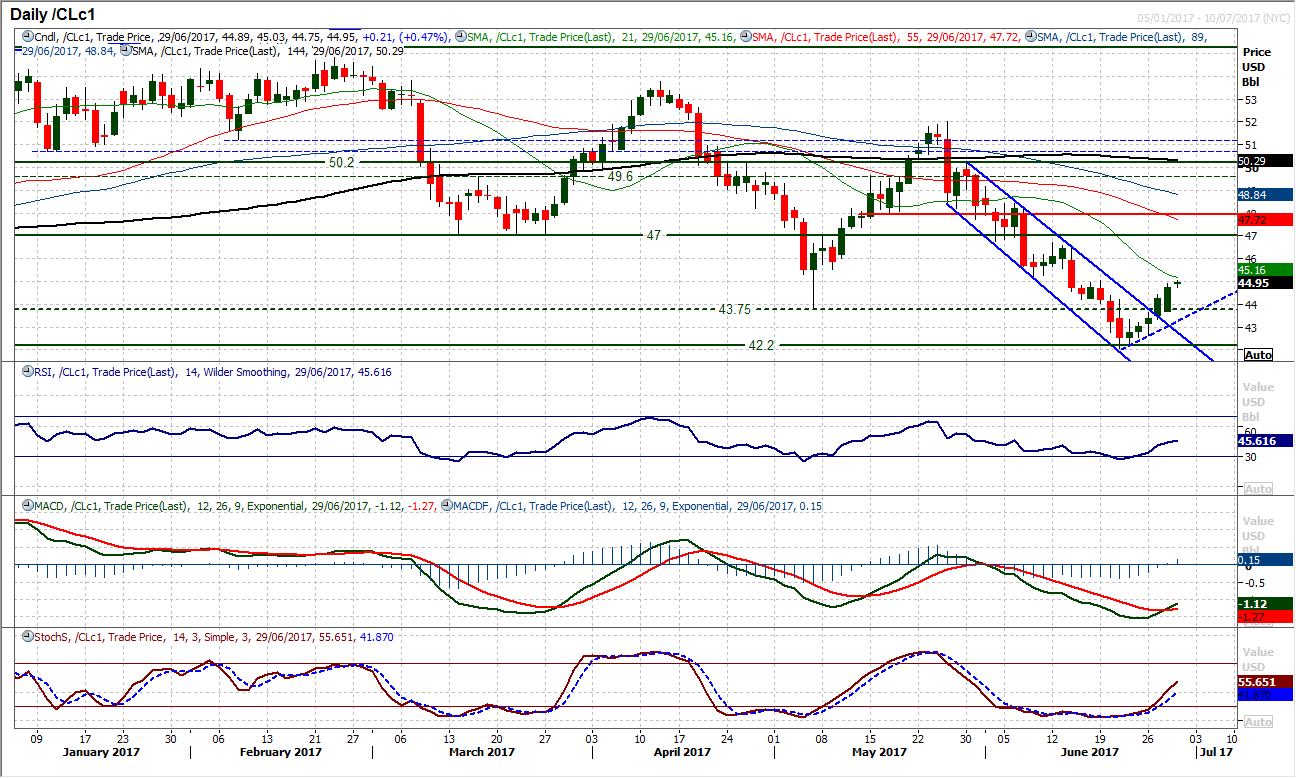
WTI Oil
The recovery in oil continues to develop. Having broken the downtrend channel on Tuesday another strong bull candle has helped to decisively break the sequence of lower highs of the former channel. The outlook continues with the momentum indicators confirming the turnaround, with the Stochastics and MACD lines both giving bull cross buy signals and the RSI at a three week high. The bulls will now be looking for a decisive break above initial resistance at $45.05 which is the first key reaction high within the old channel. A break through this resistance would signal the development of a new trend formation. It would also open the old key support which is now key medium term resistance $46.70/$47.00. The hourly chart shows initial support at $43.90/$44.45 which was traded just prior to the EIA inventories, with further support at $43.55. The near term bulls are increasingly in control now.
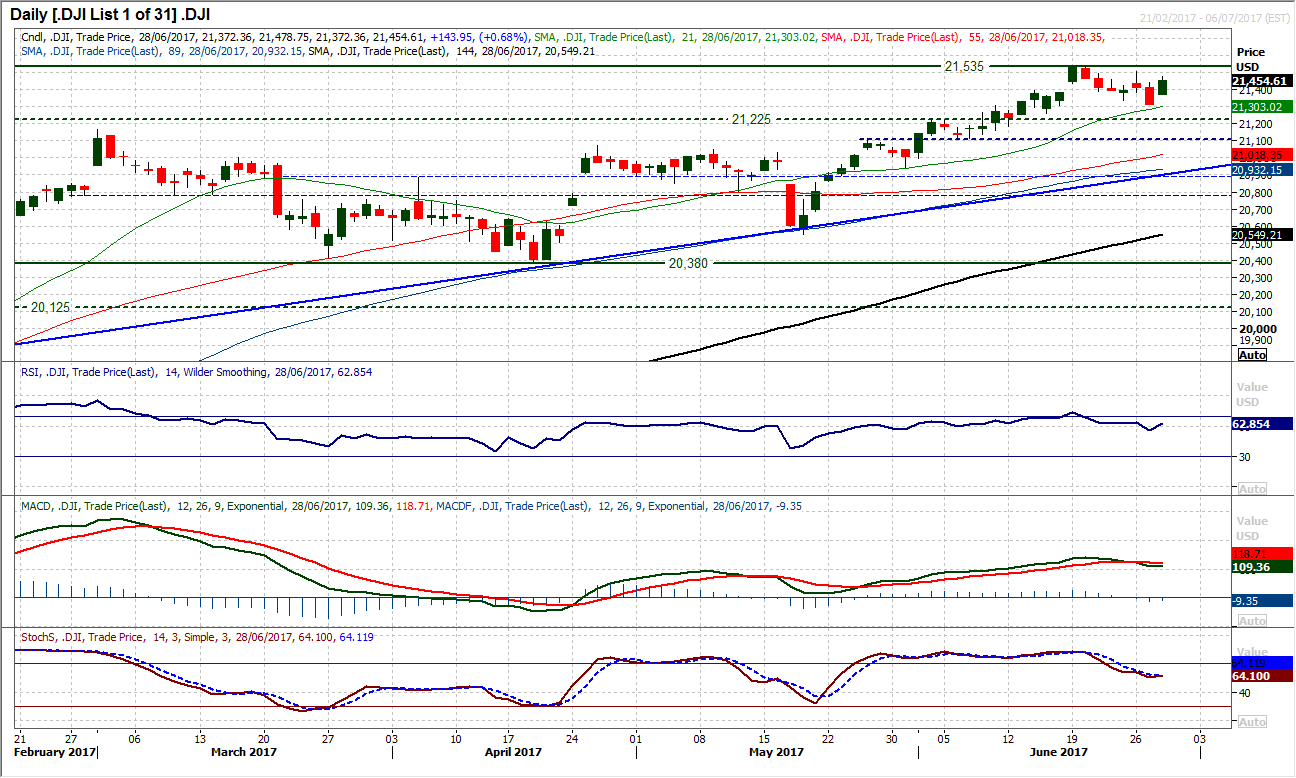
Dow Jones Industrial Average
The near term outlook is still uncertain despite yesterday’s strong bull candle which closed above the high of Tuesday. The concern is that whilst the resistance at 21,506 (from Monday’s high) remains intact the threat of a new corrective downtrend is growing. The momentum indicators are in a much more uncertain position too now with the Stochastics tracking lower and the MACD lines having topped out. The hourly chart suggests that the bulls come into the session in a positive position and a move above yesterday’s high at 21,479 would continue the positive intent. A move above 21,506 would open the high at 21,535. There is initial support at yesterday’s traded low at 21,372 with Tuesday’s low at 21,310.
Author

Richard Perry
Independent Analyst


