Dollar strong post Fed minutes but yen resumes outperformance

Market Overview
The Fed minutes initially gave equity traders what they wanted. Limited fear of inflation and an improving economic outlook. However the reaction on the bond markets eventually drove more of a fearful response. The addition of one word to the outlook, “further” with regards to policy tightening, pulled US Treasury yields higher and the reaction subsequently spooked equity markets. The dollar has rallied as it was a positive economic position rather than inflation driving yields higher, but equity markets are concerned that three hikes in 2018 may actually become four. Fear is helping to pull traders back into the yen once more. My feeling is that this is a bit of a heavy-handed over-reaction which will be unwound. The market has needed to continue to price in the three hikes, but there is little need for the Fed to really spook the markets with accelerating tightening. However, fear is a significant enemy in these markets now.

Wall Street closed lower again with the S&P 500 -0.5% at 2701, whilst Asian markets were broadly lower (Nikkei -1.1%) and European markets are opening strongly down. Can the bulls react to prevent renewed selling fears from taking hold? In forex, the dollar is strong across the majority of the majors, but the yen is the main outperformer today. In commodities, the stronger dollar is hitting gold by a couple of dollars, whilst oil is a percent lower even though the API crude stocks showed a surprise drawdown.
For economic data today, the German Ifo Business Climate is at 0900GMT and is expected to slip to 117.1 (from 117.6 last month). Then the market is not forecasting any revisions to the second reading of UK Q4 2017 GDP growth at 0930GMT which is expected to remain at+0.5%. The ECB Monetary Policy Meeting Accounts at 1230GMT will also be eyed and could drive some volatility through the euro. US Weekly Jobless Claims are at 133GMT and are expected to remain around 230,000 where it was last week. The EIA Oil Inventories are a day delayed this week due to Presidents Day and are at 1600GMT with the crude oil stocks expected to again grow by 2.0m barrels (after +1.8m barrels last week), with distillates in drawdown by -1.5m barrels (-0.5m barrels last week) and gasoline inventories in drawdown by 0.7m (+3.5m last week). The comments from the FOMC’s Bostic who is a voting member in 2018 will also be watched.
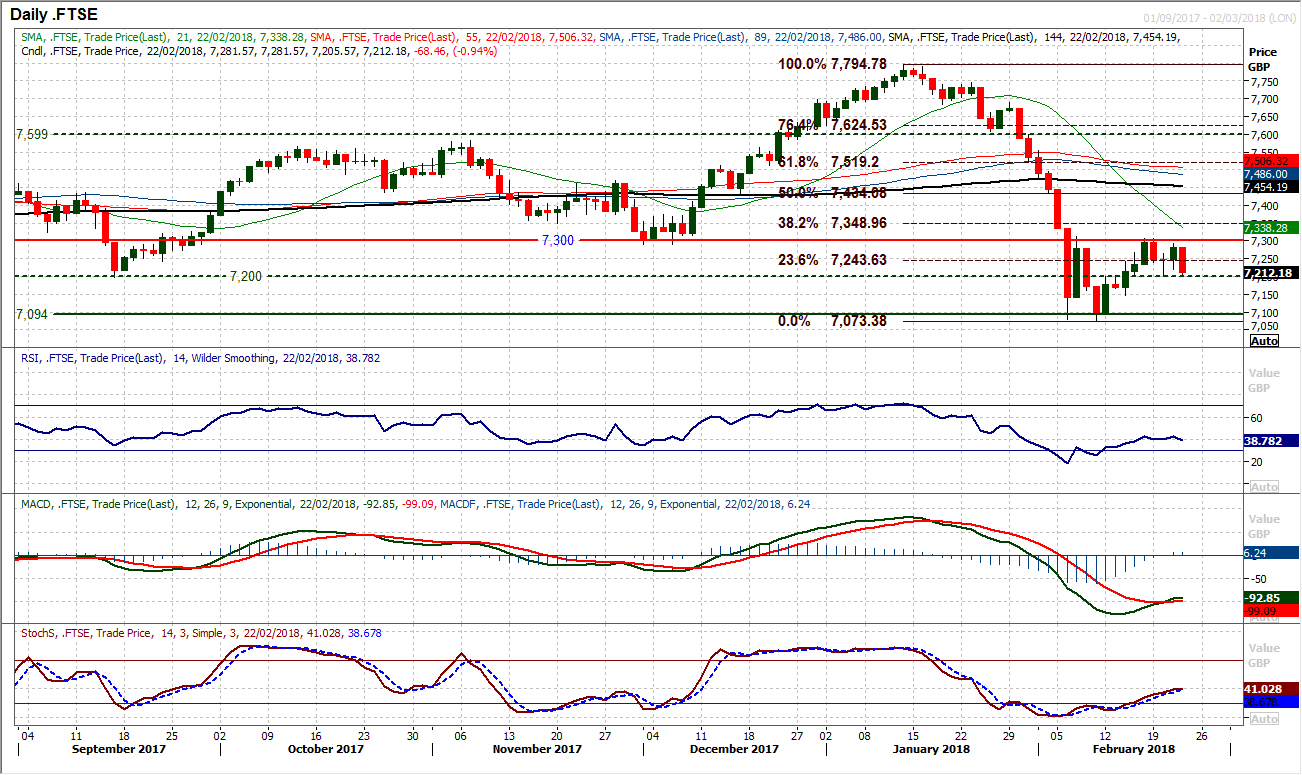
Chart of the Day – FTSE 100
At yesterday’s close, the recovery on FTSE 100 had been on the brink of a key technical breakout. The original spike rebound failed at 7312 before retreating back to form a low at 7073. Last week’s recovery could not quite break back above 7312 however after yesterday’s strong bull candle the market looked ideally placed for another challenge. However a sharp sell-off on Wall Street in the wake of the Fed minutes has changed the emphasis of the market this morning. How the bulls respond to the initial downside this morning will be key. Holding above 7202 is the first aim in a fast moving market, but then the bulls will look to close back above the 23.6% Fib retracement at 7244. This all comes with the momentum indicators all improving, with the RSI into the low 40s, the Stochastics rising and most importantly, the MACD lines posting a bullish crossover. Ultimately, a move above 7312 would complete a base pattern, but tht is for another day hopefully. Today is about damage limitation.
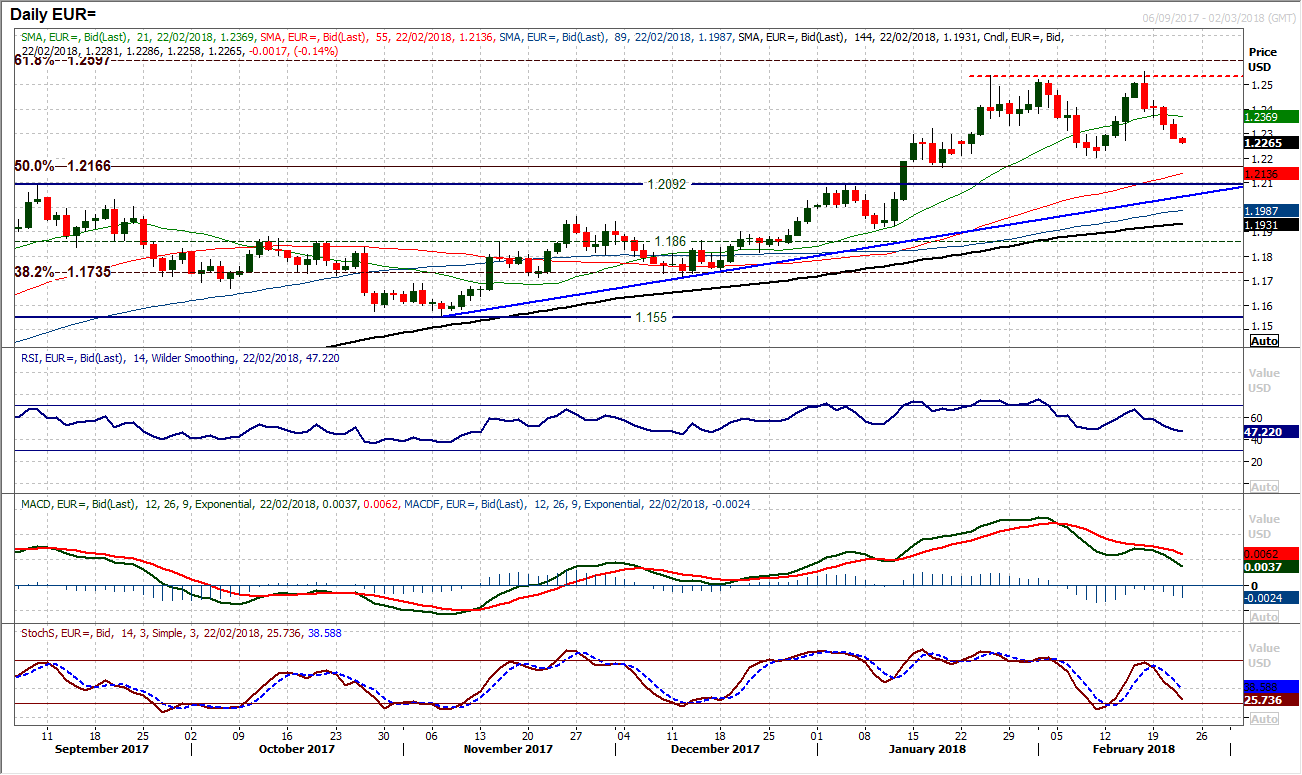
EUR/USD
The dollar rebound continues to drag EUR/USD lower as a fourth consecutive negative candlestick formation has pulled the pair further lower and within touching distance of key near term support. With the Average True Range of exactly 100 pips today the February low of $1.2205 is in reach today. Considering the momentum indicators continue to deteriorate, the potential for a test of this key low is certainly growing. This remains a near term correction within a medium term uptrend and is still likely to be a good medium term buying opportunity, but the near term risk is to the downside for now. The hourly chart shows clear selling on any opportunity, with the spike high following the Fed minutes to $1.2360 now being a key level near term. Below $1.2205 there is further support at $1.2163 and $1.2090 but it would also complete a small top pattern.
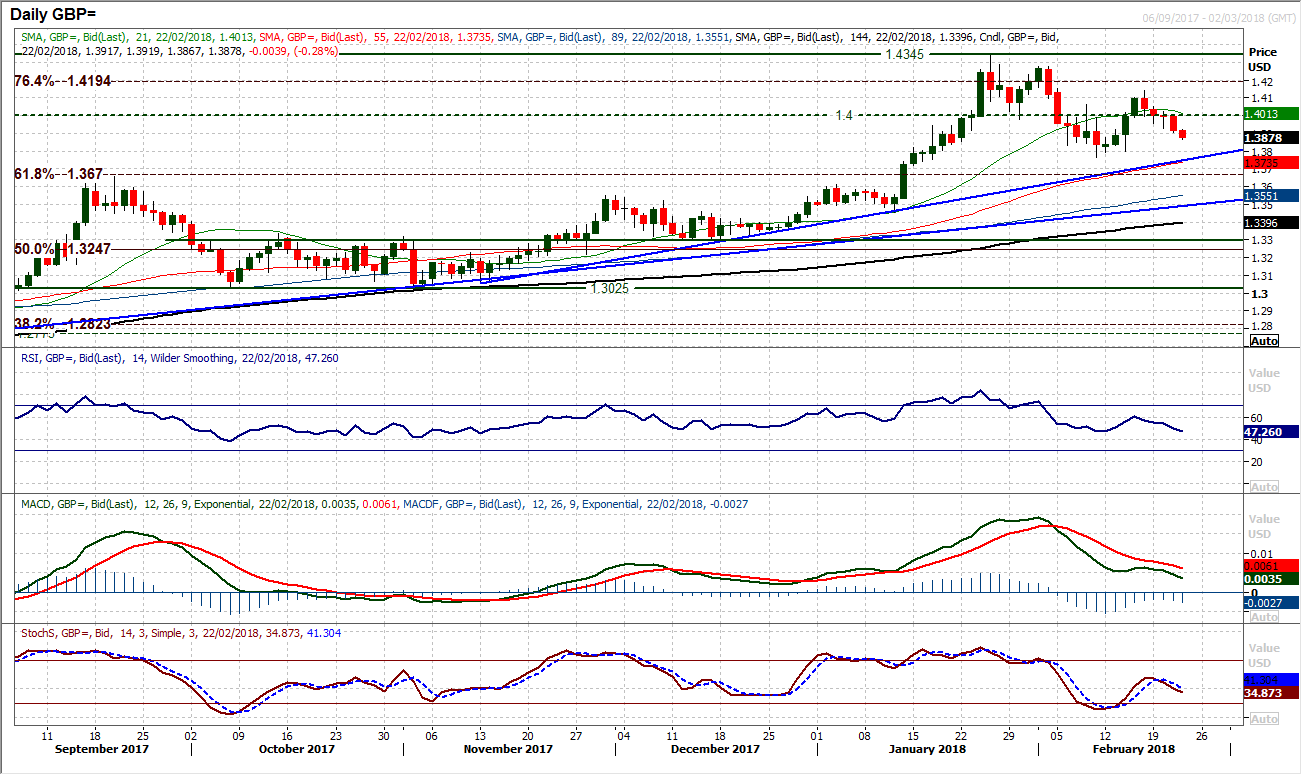
GBP/USD
Cable is beginning to find corrective traction as a fourth consecutive negative session formed yesterday. This comes with the momentum indicators tracking lower across the board and a retreat towards the three month uptrend and rising 55 day moving average (currently $1.3735) could be seen. At the least, the risk of a pull back to the support of the key February low at $1.3765 could play out. The hourly chart shows a consistent run of lower highs and lower lows, with the resistance left in the wake of the Fed minutes at $1.4010 now being a key barrier. The hourly RSI shows rallies failing around 50/60 and MACD lines unable to recover above neutral now. With further early downside seen today, the initial support is $1.3800 before $1.3765. This still remains a near term correction within a medium term uptrend but for now the selling pressure is the driving force on Cable.
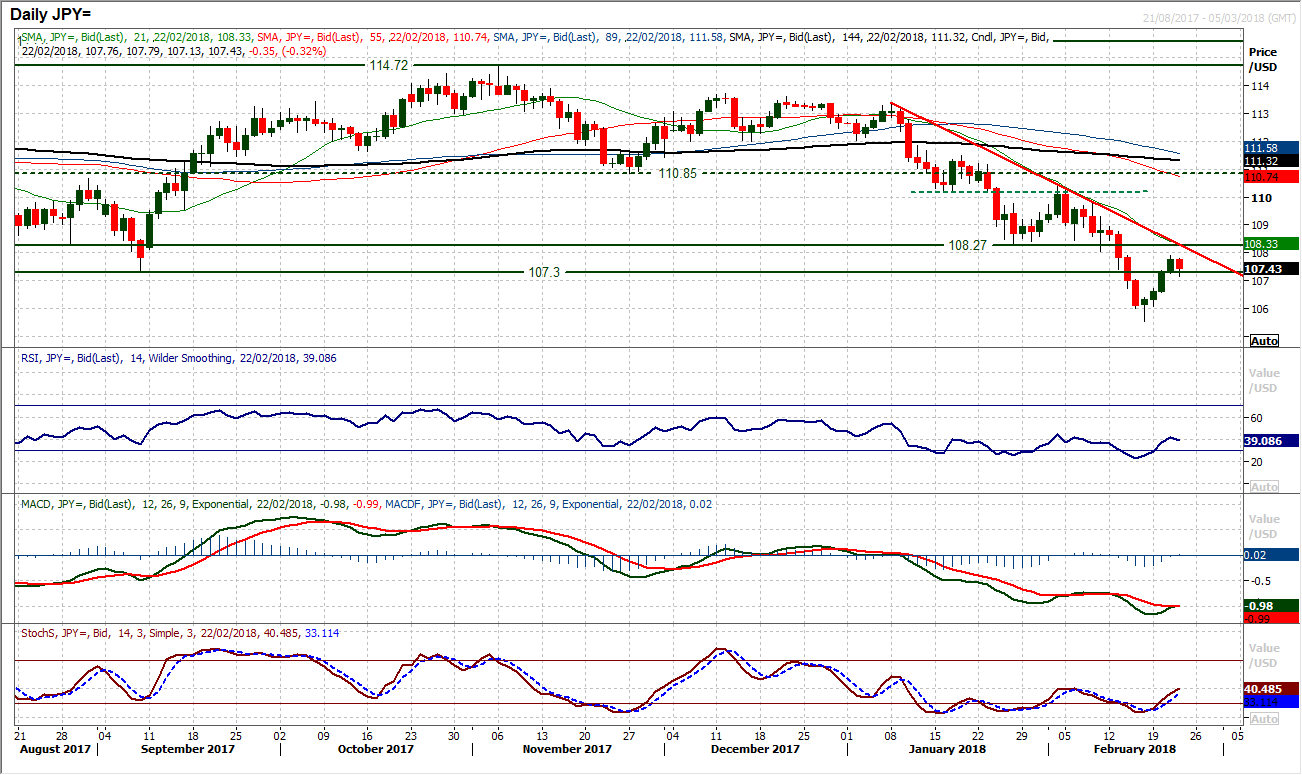
USD/JPY
The technical set-up on Dollar/Yen to sell into rallies is excellently configured. The big question is whether this dollar rally will flounder within the overhead supply of the resistance range 107.30/108.30. It is interesting to see the dollar strengthening across majors this morning, but on Dollar/Yen, once more it looks as though the buyers of the yen are the stronger force. This is beginning to stunt the recovery and if this continues, questions will arise as to whether this is the time to sell. For now this is merely a consolidation and there are no renewed sell signals. The hourly chart may hold some clues, with the RSI, MACD and Stochastics now tailing off. There is minor pivot support around 106.80 which is also supportive below today’s low of 107.13. A positive yen remains a strong play in these current market conditions. Initial resistance at yesterday’s high of 107.90.
Gold
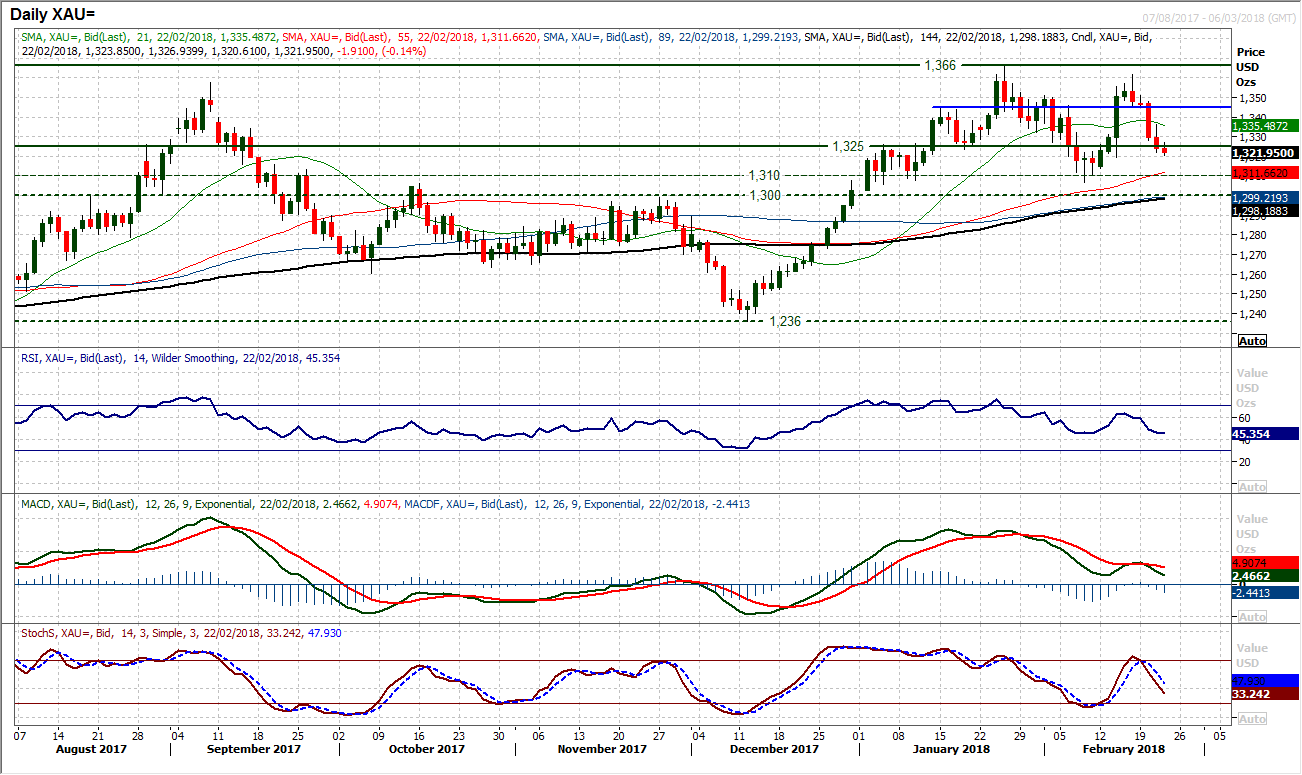
Another negative close on gold has taken the market below the pivot around $1325. With the momentum indicators configured negatively there is an increased risk now of a retreat back to the February low at $1306.80. The final real level of support of note is at $1319.40 which was the last real higher low from the previous rally. However with the hourly chart indicators negatively configured there is a consistent theme of selling into strength now. The Fed minutes have left a resistance at $1336 which now becomes a key near term barrier, but for now the pressure is to the downside. For now this remains a near term correction but if the support of the long term pivot at $1300/$1310 decisively fails then the selling could increase.
WTI Oil
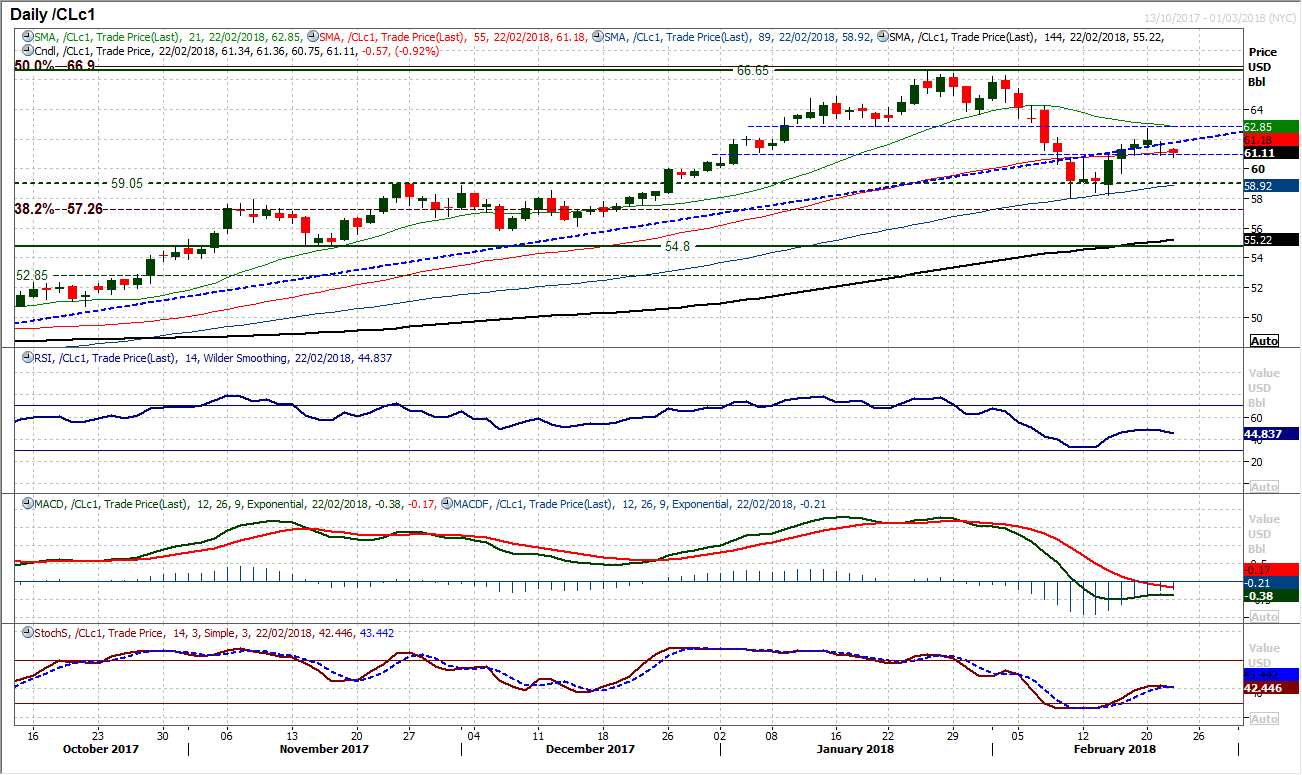
The slip back in the oil price during the middle of this week seems to have been contained for now, with the momentum indicators maintaining a neutral configuration. Interestingly this comes as the market has bounced off support of an old pivot around $60.85. This means that trading in WTI is now within two pivots with support at $60.85 and resistance at $62.85. After a relatively benign few candles, closing outside these pivots should begin to drive direction once more. Pressure is initially to the downside today as the oil price is hampered by renewed dollar strength, but we would still be looking for a close below $60.85 to drive near term direction. It would then open a retreat back towards the key support around $59/$60.
Dow Jones Industrial Average
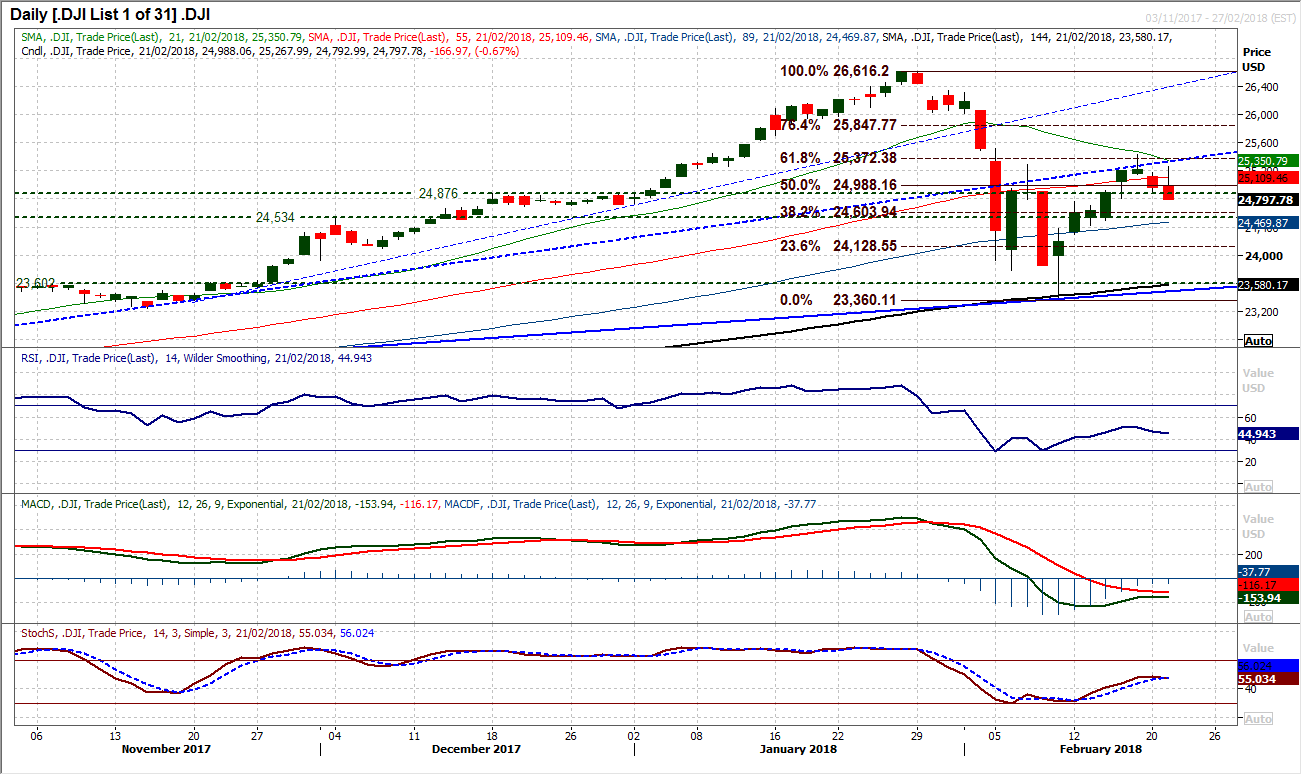
The recovery is beginning to become pressured, as the market reacted negatively to the Fed meeting minutes yesterday. The hourly chart showed an initial positive response but very late in the session this was replaced with sharp selling pressure into the close. This left a strong bearish engulfing candle and really begins to increase the pressure to the downside. Losing the supports at 24,884 and then 24,809 suggest the outlook moving into reverse. Reactio today will be key as a breach of the support of the higher low at 24,421 would re-pen a test of the lows again. Momentum indicators remain positively configured on the hourly chart but if the hourly RSI begins to fail below 30 this would be of increased concern. The bulls do though need to push back above 25,179 to re-establish more positive traction once more.
Author

Richard Perry
Independent Analyst


