Dollar softens on FOMC’s dovish stance

Despite a stronger-than-expected U.S. Producer Price Index (PPI), the dollar remains subdued due to the Fed's balanced assessment of inflation and recession risks
The dollar struggles below the $106 mark as the Federal Reserve adopts a dovish stance, signalling a potential end to its rate-hiking cycle. Despite a stronger-than-expected U.S. Producer Price Index (PPI), the dollar remains subdued due to the Fed's balanced assessment of inflation and recession risks, revealed in the September Federal Open Market Committee (FOMC) meeting minutes. Gold prices surged on the back of the dollar's softened position and ongoing geopolitical tensions in the Middle East. In contrast, oil markets experienced a sharp 3% decline following a substantial increase in crude stockpiles reported by the American Petroleum Institute (API). On top of that, Saudi Arabia's commitment to stabilising oil prices amid Middle East conflicts tempers the market's apprehension.
Market movements
Dollar index
The US Dollar remained steady as it tested robust support levels, with the US Producer Prices Index revealing a slight drop in underlying inflation, aligning with market expectations. However, the retreat in US Treasury yields, fueled by a chorus of dovish tones from Federal Reserve members, has tempered the need for imminent rate hikes. Investor attention is now keenly focused on the forthcoming US Consumer Price Index (CPI) data for potential market movements.
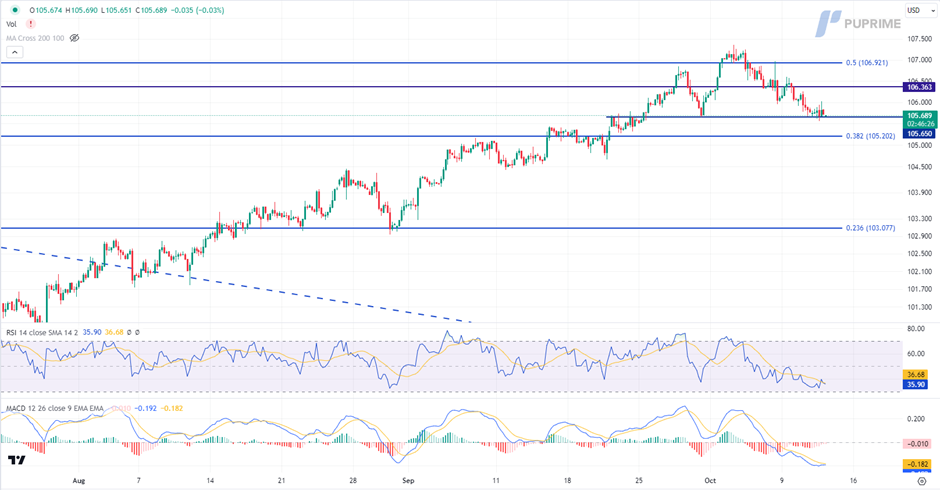
The Dollar Index is trading lower while currently testing the support level. MACD has illustrated increasing bearish momentum, while RSI is at 36, suggesting the index might enter oversold territory.
Resistance level: 106.35, 106.90.
Support level: 105.65, 105.20.
XAU/USD
As geopolitical tensions in the Middle East continue to rise, investors have sought refuge in safe-haven assets, prompting a surge in the gold market. Gold's persistent climb above a formidable resistance level is noteworthy, though lingering uncertainties, coupled with critical economic data releases, call for caution when navigating these markets.
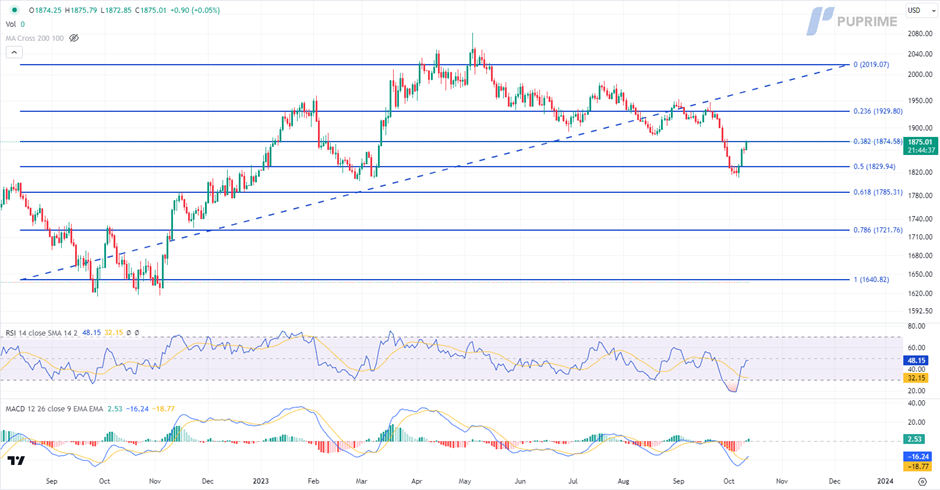
Gold prices are trading higher while currently near the resistance level. MACD has illustrated increasing bullish momentum, while RSI is at 48, suggesting the commodity might extend its gains after breakout since the RSI rebounded sharply from oversold territory.
Resistance level: 1875.00, 1930.00.
Support level: 1830.00, 1785.00.
EUR/USD
The euro maintains its upward trajectory against the dollar, capitalising on the greenback's weakened stance. Despite robust U.S. Producer Price Index (PPI) data, the dollar remains subdued due to the Federal Reserve's dovish stance, as revealed in the September Federal Open Market Committee (FOMC) meeting minutes. Investors increasingly anticipate a possible rate pause from the Fed in November, contributing to the euro strengthening against the dollar.
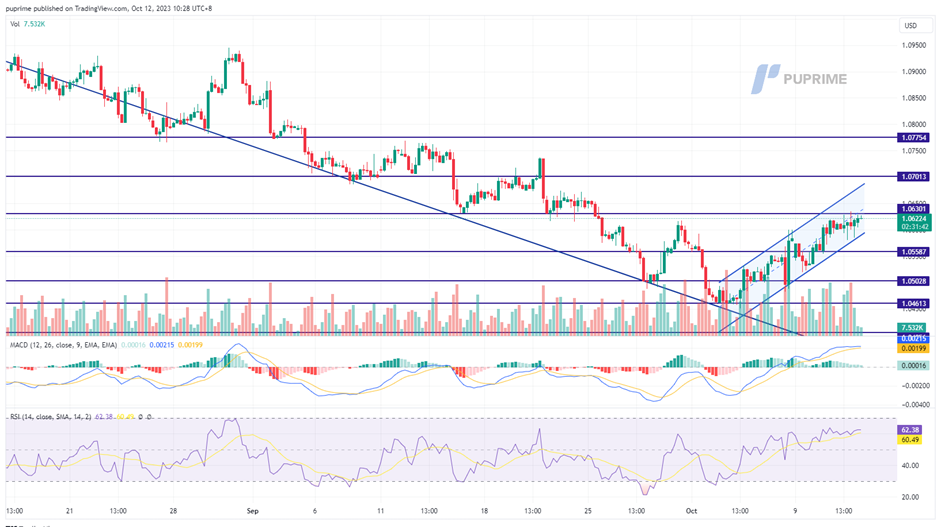
The EUR/USD pair continues to trade within the uptrend channel, suggesting the bullish momentum is still intact with the pair. The RSI and the MACD have eased despite continuing to move upward, suggesting the bullish momentum is easing.
Resistance level: 1.0630, 1.0700.
Support level: 1.0500, 1.0460.
USD/JPY
The USD/JPY pair maintained a flat trading pattern ahead of pivotal events. On the Japanese yen front, traders should remain vigilant for potential monetary interventions by the Bank of Japan, offering potential trading signals. Additionally, market volatility for the Japanese yen is anticipated to remain elevated in the lead-up to the release of US inflation data, demanding investors' vigilant attention.
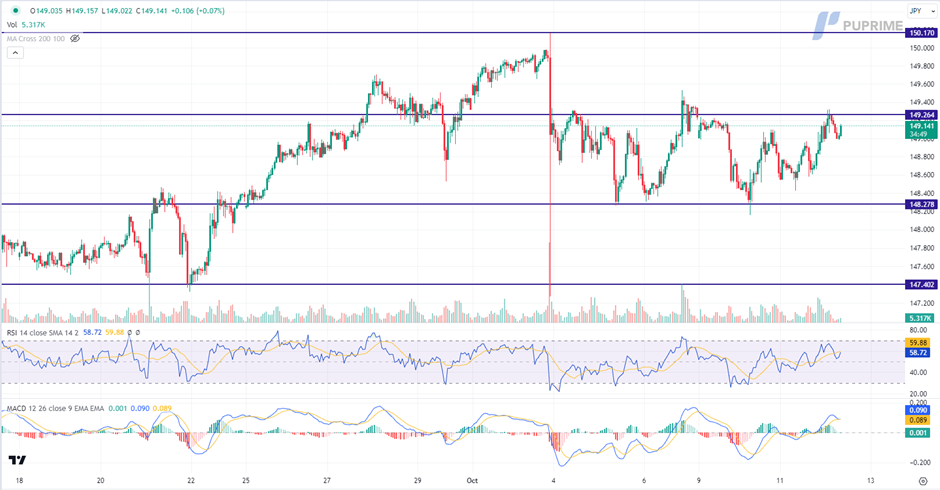
USD/JPY is trading higher while currently near the resistance level. However, MACD has illustrated diminishing bullish momentum, while RSI is at 58, suggesting the pair might experience technical correction since the RSI retreated sharply from overbought territory.
Resistance level: 149.25, 150.15.
Support level: 148.30, 147.40.
Dow jones
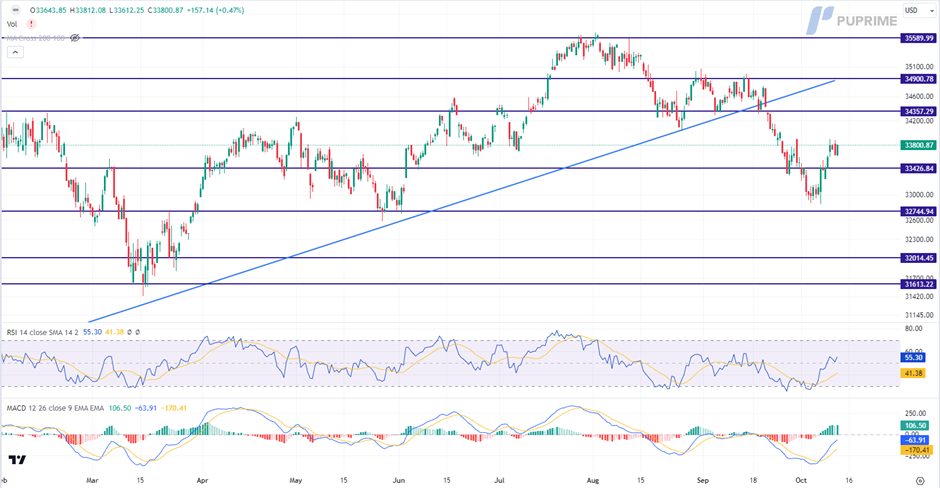
US equity markets displayed resilience, bolstered by the Federal Reserve's dovish signals, instilling confidence in rate stability. Falling US Treasury yields, combined with the Federal Reserve's accommodating stance, are set to fuel the allure of US equities. In the backdrop, benchmark 10-year Treasury yields hit a two-week low, as investors flocked to US Treasury bonds in response to escalating geopolitical crises.
The Dow is trading higher following the prior breakout above the previous resistance level. MACD has illustrated increasing bullish momentum, while RSI is at 55, suggesting the index might extend its gains toward resistance level since the RSI stays above the midline.
Resistance level: 34355.00, 34900.00.
Support level: 33425.00, 32745.00.
GBP/USD
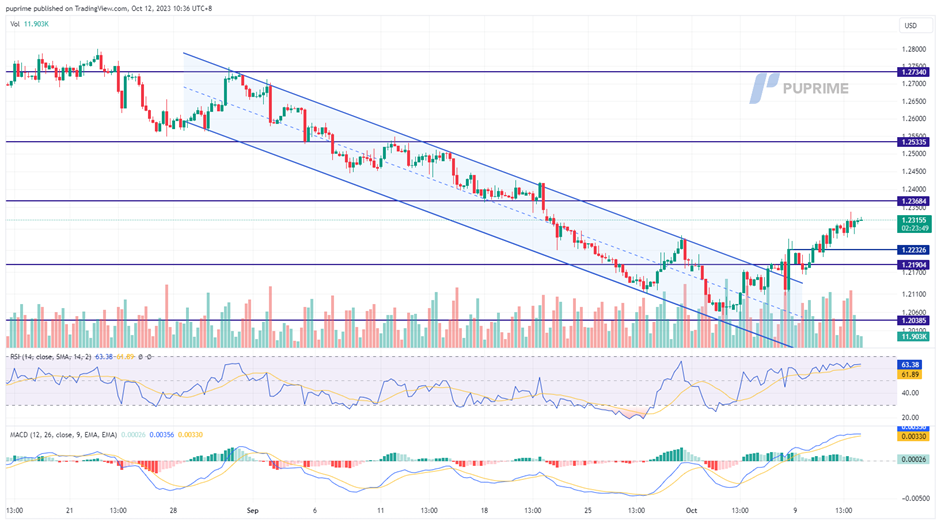
The British Pound continues to gain, buoyed by a weakening dollar. Continuous dovish comments from Federal Reserve officials have hampered the dollar's performance, with the latest Federal Open Market Committee (FOMC) meeting minutes suggesting that the Fed's rate hikes have reached their zenith. Investor focus now shifts to the UK, awaiting key economic indicators such as GDP and production data due today, poised to influence the Pound's strength further.
The Cable's bullish momentum seems to have eased after its gained more than 1% in this week. The RSI and the MACD both poised flat at the higher level, suggesting the bullish momentum has eased.
Resistance level: 1.2370, 1.2530.
Support level: 1.2190, 1.12040.
NZD/USD
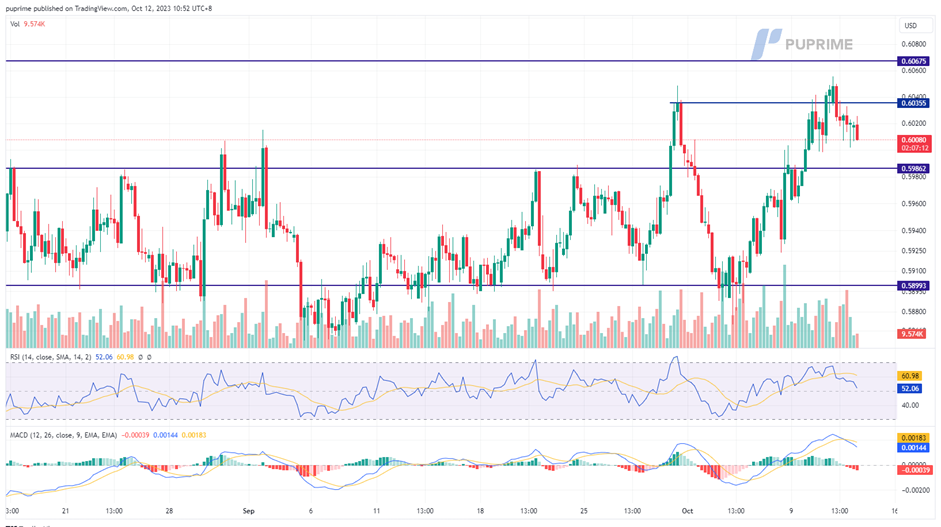
The New Zealand Dollar, or Kiwi, experienced a slight retreat after breaching its recent peak. Despite this, the pair has displayed robust upward momentum over the past five sessions, suggesting a strong bullish trend. With the New Zealand election on the horizon, market sentiment indicates expectations for increased stability in the Kiwi's value. Additionally, investors are closely monitoring the upcoming U.S. Consumer Price Index (CPI) release, with widespread anticipation of a lacklustre reading that could further bolster the Kiwi's strength in the market.
The Kiwi avoided forming a double-top price pattern and breaking above its recent peak but was trading lower last night. The RSI and the MACD decline, suggesting the bullish momentum has vanished.
Resistance level: 0.6070, 0.6130.
Support level: 0.5980, 0.5890.
CL Oil
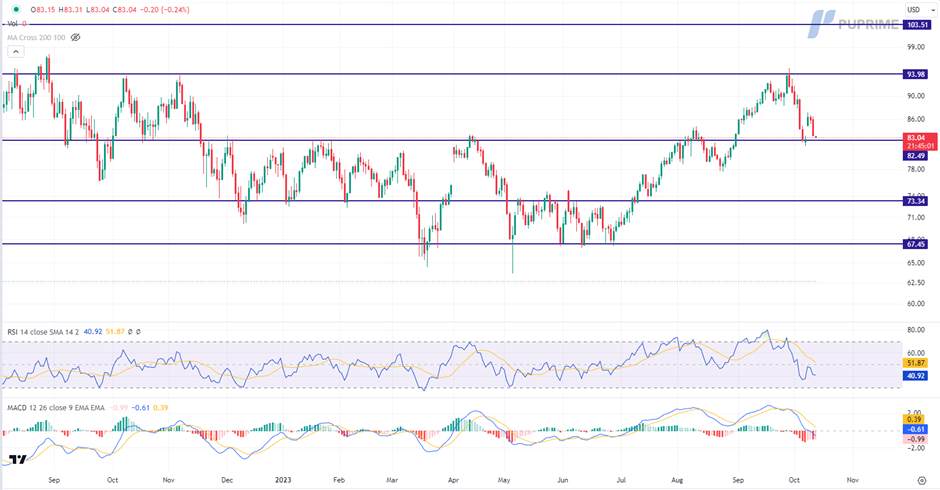
Oil prices witnessed a significant slump as OPEC's largest producer, Saudi Arabia, moved to stabilise the market. Fears of supply disruptions amid escalating Middle East tensions prompted Saudi Arabia's commitment to market stability. Collaborating with regional and international partners, the nation reiterated its dedication to steadying the volatile oil market.
Oil prices are trading lower while currently testing the support level. MACD has illustrated increasing bearish momentum, while RSI is at 41, suggesting the commodity might extend its losses after breakout since the RSI stays below the midline.
Resistance level: 94.00, 103.50.
Support level: 82.50, 73.35.
Author

PU Prime team
PU Prime
PU Prime is an award-winning CFD broker offering clients access to multiple products across multiple asset classes. Traders will have access to FX, Commodities, Indices, Share CFDs and Bonds.


