Dollar Index plummets on soft NFP and unemployment rate

The dollar index plummeted following last Friday's U.S. Nonfarm Payroll report and the Unemployment rate data, indicating a softening job market and further easing U.S. inflation.
The dollar index plummeted to September levels following last Friday's U.S. Nonfarm Payroll report and the Unemployment rate data, indicating a softening job market and further easing U.S. inflation. Despite the softening dollar, commodity prices including gold and oil failed to rally due to easing Middle East tensions. All eyes are now on the Reserve Bank of Australia's (RBA) upcoming interest rate decision, which is expected to inject volatility into the Australian currency.
Market movements
Dollar Index
The US Dollar weakened as the latest employment data painted a grim picture. Job growth in the US slowed more than expected, pushing the unemployment rate to a nearly two-year high of 3.90%. The Bureau of Labor Statistics reported that US Nonfarm Payrolls increased by only 150,000 in October, falling short of market expectations at 180,000, and the US Unemployment rate exceeded the projected 3.80% at 3.90%.
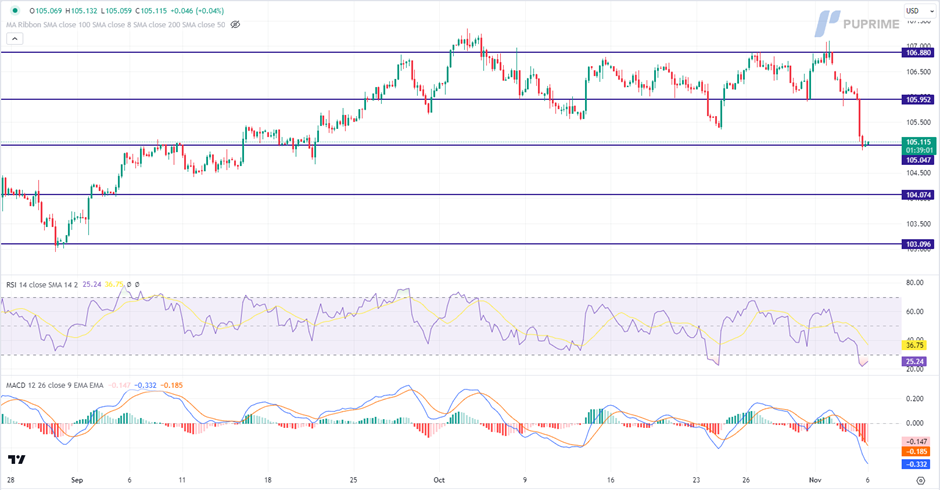
The Dollar Index is trading lower while currently testing the support level. However, MACD has illustrated diminishing bearish momentum, while RSI is at 25, suggesting the index might enter oversold territory.
Resistance level: 105.95, 106.90.
Support level: 105.05, 104.05.
XAU/USD
Gold prices initially surged following the release of disappointing US employment data. The data, indicating a slowdown in the US job market, boosted the appeal of the safe-haven gold. However, after reaching the psychological level of $2000, gold underwent a healthy retracement. Furthermore, subsiding geopolitical tensions in the Middle East limited the gains in the safe-haven gold.
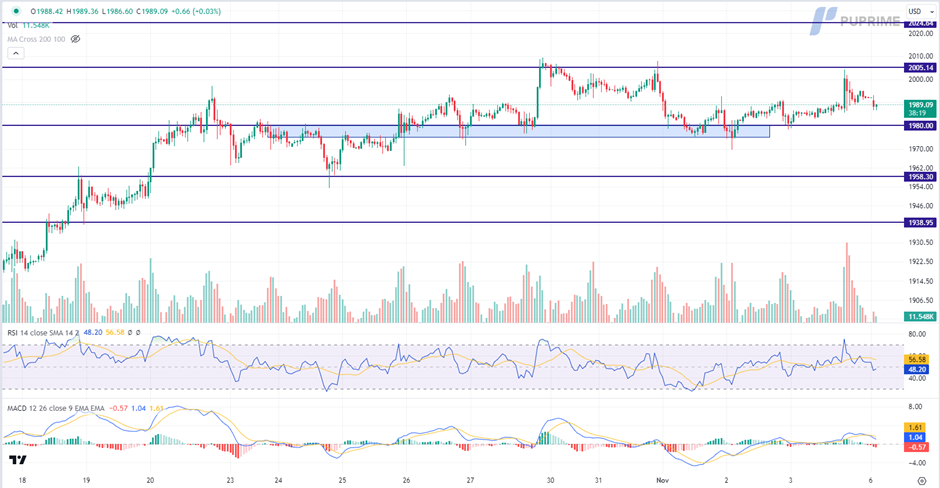
Gold is trading lower following the prior retracement from the resistance level. MACD has illustrated increasing bearish momentum, while RSI is at 48, suggesting the commodity might extend its losses since the RSI stays below the midline.
Resistance level: 2005.00, 2025.00.
Support level: 1980.00, 1960.00.
EUR/USD
Despite higher-than-expected unemployment rates, the euro remained resilient, surging above its previous downtrend resistance level with a nearly 1% increase last Friday. Weak job data in the U.S bolstered the euro's strength. The disappointing U.S. Nonfarm Payroll and unemployment rate figures fueled discussions in the market about the Fed possibly nearing a rate cut.
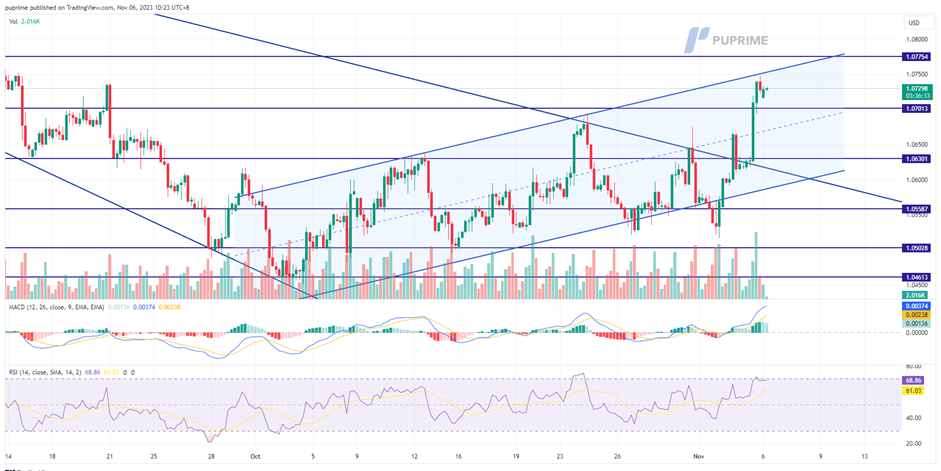
EUR/USD is currently trading within its uptrend channel formed since October. The RSI is on the brink of breaking into the overbought zone while the MACD has been moving upward, suggesting the bullish momentum for the pair remains solid.
Resistance level: 1.0775, 1.0866.
Support level: 1.0700, 1.0630.
GBP/USD
Pound Sterling surged on the back of robust economic data, outperforming amidst a weakening U.S. dollar. Strong UK Composite and Services PMI figures bolstered the currency, with investors eagerly awaiting the UK's GDP release on Thursday. The dollar slumped following disappointing U.S. job data, sparking speculation that the Fed might be on the verge of implementing monetary easing measures.
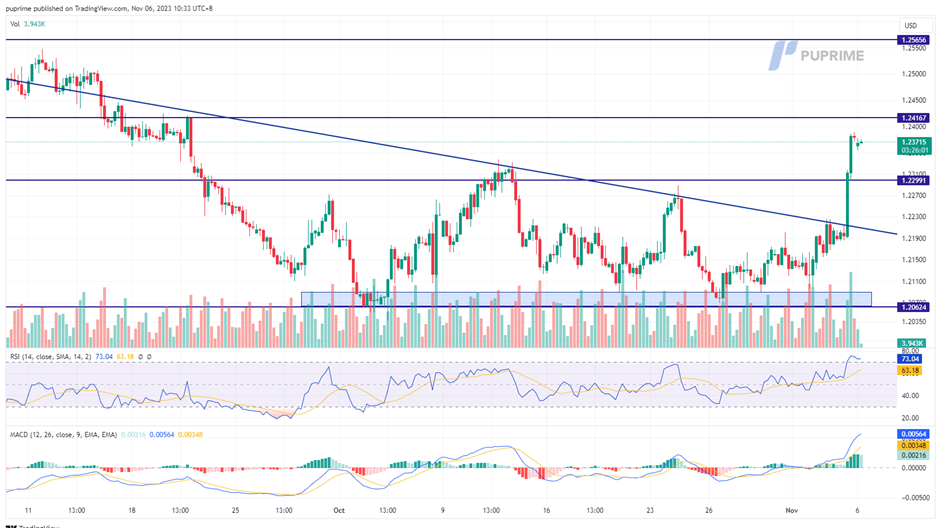
The Cable spike up strongly above its downtrend resistance level and traded to its highest level since September signalling a strong bullish trend. The RSI has got into the overbought zone while the MACD continues to climb upward, suggesting the bullish momentum is strong.
Resistance level: 1.2420, 1.2570.
Support level: 1.2300, 1.2060.
Dow Jones
US equity markets surged, driven by signs of a cooling labour market and a softer services sector, fueling expectations that the Federal Reserve might conclude its tightening monetary cycle. US two-year Treasury yields dropped by 15 basis points to 4.84%, leading to robust gains across Wall Street. The S&P 500 enjoyed its most substantial week of growth in 2023, thanks to the decline in US Treasury yields.
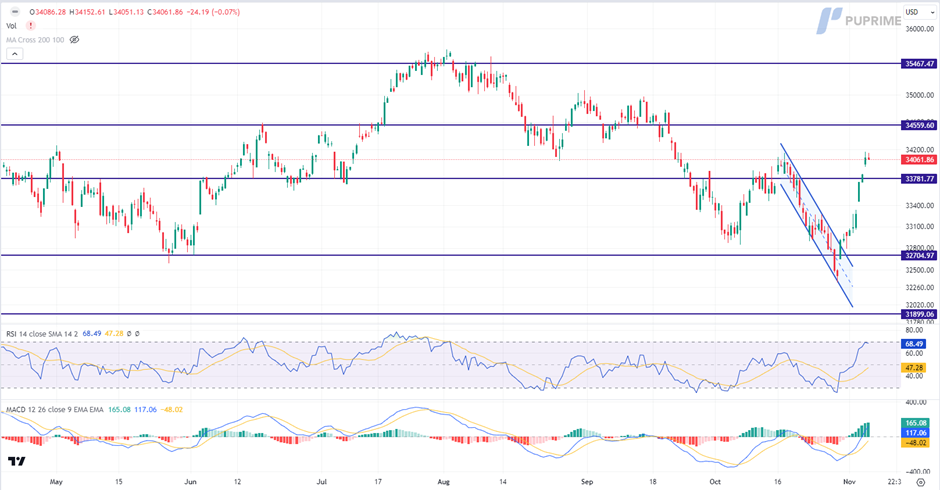
The Dow is trading higher following the prior breakout above the resistance level. MACD has illustrated increasing bullish momentum, while RSI is at 68, suggesting the index might extend its gains toward resistance level since the RSI stays above the midline.
Resistance level: 34560.00, 35465.00.
Support level: 33780.00, 32705.00.
USD/JPY
The USD/JPY pair traded back to its liquidity zone below 150 mark as the dollar plummeted last Friday due to soft Job data. However, the Japanese Yen continue to be weak as the BoJ’s Monetary policy Meeting Minutes shows the BoJ board members see no intention for additional tweak to the YCC and has no rush in getting out from the Ultra-loose monetary policy; the dovish stance from the BoJ continue to put pressure on the Japanese Yen’s strength.
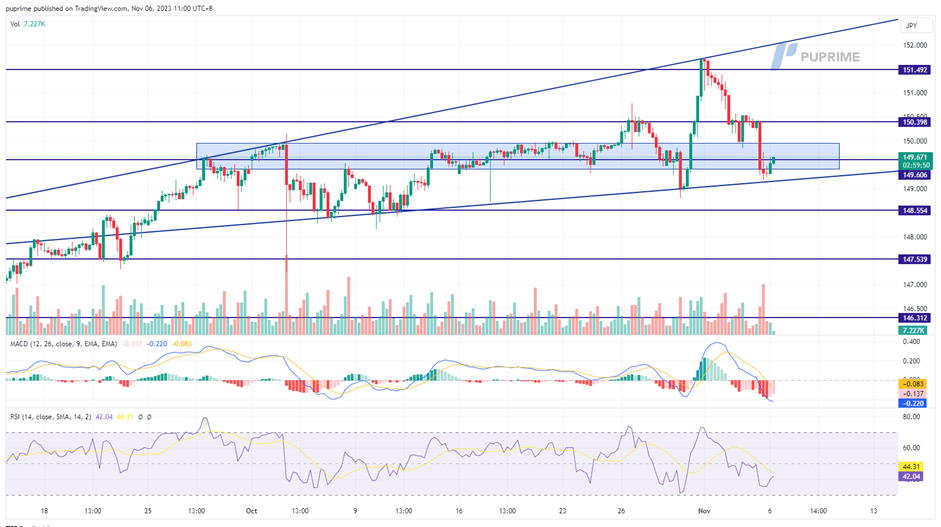
USD/JPY retrace from its recent high and is back to its liquidity zone and provide a neutral signal for the pair. The RSI has plunged from the overbought zone while the MACD has crossed on the above and has dropped to below the zero line suggesting the bearish momentum is forming.
Resistance level: 150.40, 151.55.
Support level: 148.55, 144.54.
AUD/USD
The AUD/USD pair surged significantly in anticipation of the upcoming RBA interest rate decision, capitalising on the weakened U.S. dollar to maintain its elevated position. With the RBA emphasising a data-dependent strategy for policy decisions, positive economic indicators in recent months have led investors to speculate on a potential November rate hike.
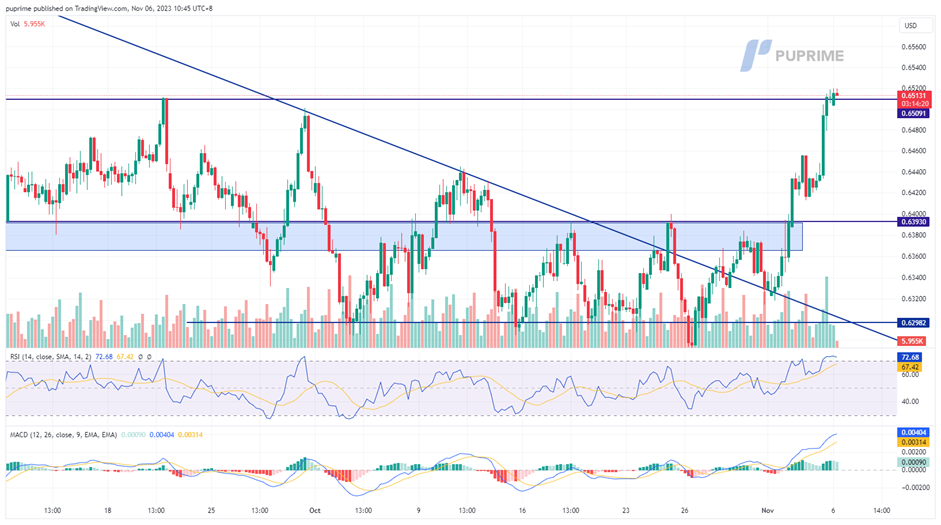
The AUD/USD traded strongly above its liquidity zone, suggesting a strong bullish trend. The RSI has been staying in the overbought zone while the MACD continues to climb upward, suggesting the bullish momentum remains strong.
Resistance level: 0.6620, 0.6710.
Support level: 0.6400, 0.6300.
CL Oil
Diplomatic initiatives by global leaders to resolve the Israel-Hamas conflict have diminished the chances of oil supply disruptions, leading to a decline in oil prices. On the other hand, the bearish economic outlook, fueled by a string of lacklustre economic reports from the US, UK, EU, and China, has raised doubts about the sustainability of oil demand, further pressuring oil prices.
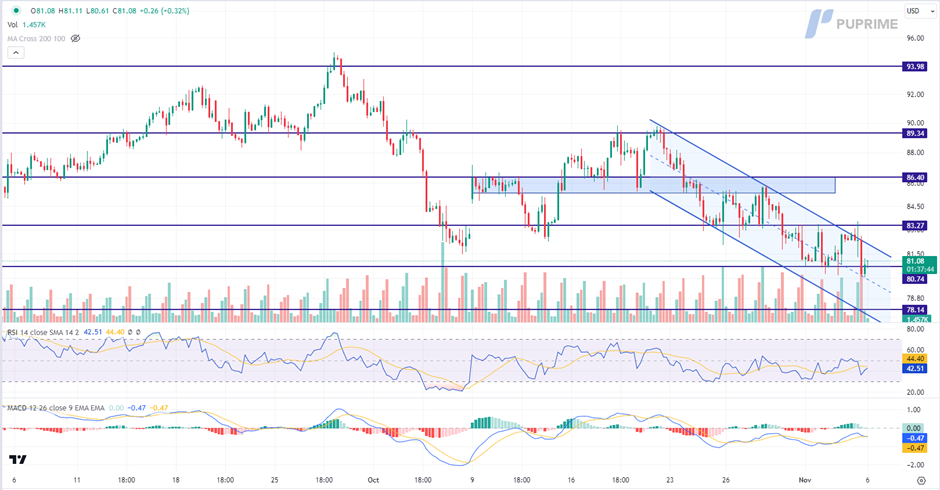
Oil prices are trading lower while currently testing the support level. MACD has illustrated diminishing bullish momentum, while RSI is at 43, suggesting the commodity might extend its losses after breakout since the RSI stays below the midline.
Resistance level: 83.25, 86.40.
Support level: 80.75, 78.15.
Author

PU Prime team
PU Prime
PU Prime is an award-winning CFD broker offering clients access to multiple products across multiple asset classes. Traders will have access to FX, Commodities, Indices, Share CFDs and Bonds.


