Dollar and equities struggle as key US and Chinese data misses

Market Overview
Markets are seeing risk aversion and an increasingly weaker dollar as traders assess the impact of weaker than expected US payrolls on Friday and surprisingly weaker Chinese economic data. Friday’s US jobs report was lukewarm at best, but with drab jobs growth, a touch disappointing wage growth and fewer hours worked, it nudges the debate on about whether the US economic recovery is running out of steam. The trade dispute also came into context as China’s trade data showed a stark slowdown of growth, with exports only growing by +5.4% (+10% expected) and imports just +3% (+14.5% exp). This shows that the frontloading effects of the trade dispute are now dissipating. Furthermore, Chinese CPI inflation also was lower than expected at +2.2% (+2.4% exp). It all paints a picture that the dispute is beginning to bite in China with negative implications on its trade partners and global supply lines. The dollar is under pressure across the majors this morning and risk appetite is suffering. This is especially being felt across the equities space which is reeling from elevated volatility and selling pressure.

Wall Street closed sharply lower on Friday with the S&P 500 -2.3% at 2633, with futures further lower today by -0.5%. In Asian markets the pressure was felt, with the Nikkei -2.1% whilst the Shanghai Composite was -0.8%> European markets are similarly feeling the brunt, with FTSE 100 futures around -0.6% lower and DAX futures around -1.1% lower. In forex, it is a weaker dollar across the board today but interesting to see the euro performing well on news of potential positive traction in the stand-off between Italy and the EU. In commodities there is a consolidation on gold, whilst oil traders are also taking stock after the agreement to cut production at the meeting between OPEC and Russia on Friday.
It is a fairly quiet start to the week, with initial focus on UK monthly GDP at 0930GMT which is expected to show growth of +0.1% in October. UK Industrial Production at 0930GMT is expected to grow by +0.1% in October, but actually turn the yearly data negative at -0.2% (September 0.0%) which would be the lowest since April 2017. US JOLTS jobs openings are at 1500GMT which unexpectedly jumped to 7.01m last month.
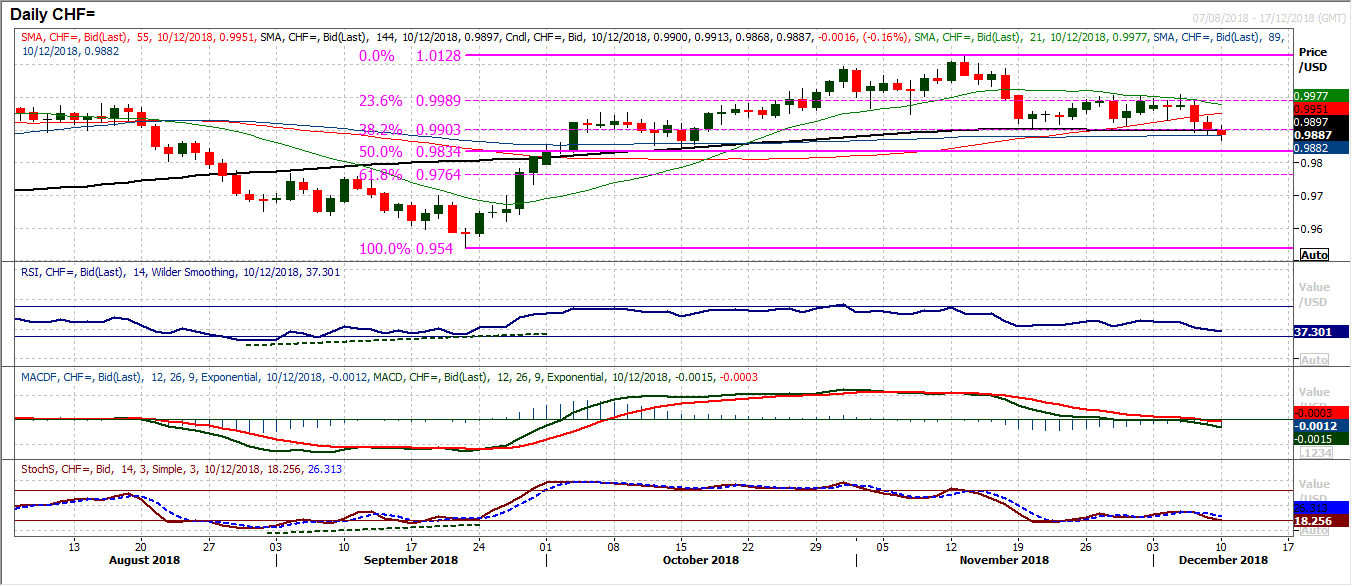
Chart of the Day – USD/CHF
The rally rolled over at 1.0128 a few weeks ago and the market has begun to retrace via a bout of Swissy outperformance. It is interesting to see that the market has spent much of that time oscillating between key Fib levels, with the 38.2% Fib retracement of 0.9540/1.0128 at 0.903 and the 23.6% Fib at 0.9989. It seems that there is a ceiling at parity now but the momentum indicators are negatively configured and looking at the MACD lines dropping below neutral and the Stochastics turning lower again, there is a deterioration. However, the Swissy strengthened on Friday to pull USD/CHF to its lowest close since mid-October on Friday and is now looking to make a decisive move lower today amidst increasingly risk averse markets. A close below the 38.2% Fib level would be a two month low and open 0.9834 at 50% Fib. The momentum indicators are confirming the breakdown, with the MACD lines tracking below neutral, the RSI falling below 40 for eleven month lows. This now means that the market is increasingly becoming a sell into strength. There is resistance around the 38.2% Fib initially now at 0.9903, with the hourly chart showing resistance 0.9890/0.9915.
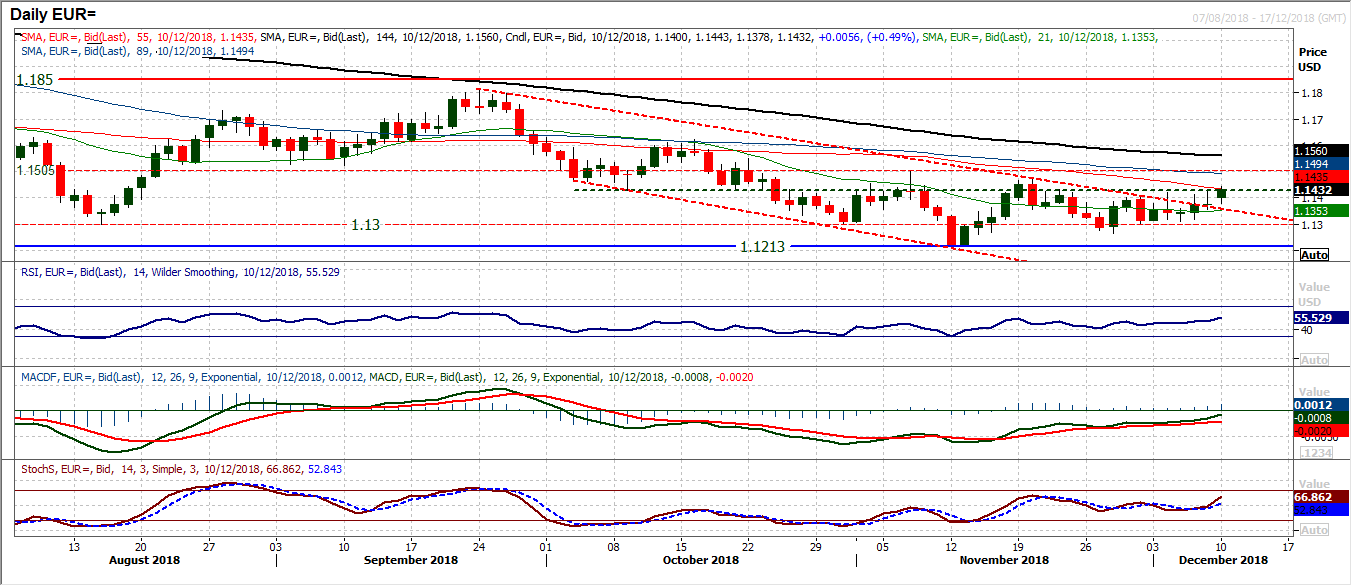
The dollar is weakening and EUR/USD is beginning to build upside traction. After a couple of weeks of consolidation, the improvement in momentum is building now with the RSI rising above 50, MACD lines rising at 8 week highs and the Stochastics also now rising. The downtrend channel of the past ten weeks has been threatened in recent days without being decisively breached, but now the move seems to be coming. Holding a move above $1.1400 (which has been difficult) is the first signal. Then the market will be looking for a break above $1.1430 which has been a near to medium term pivot. A close above $1.1470 would be a bullish move as this would form a new building run of higher lows and higher highs. The hourly chart shows support at $1.1360 above the increasingly important $1.1300.
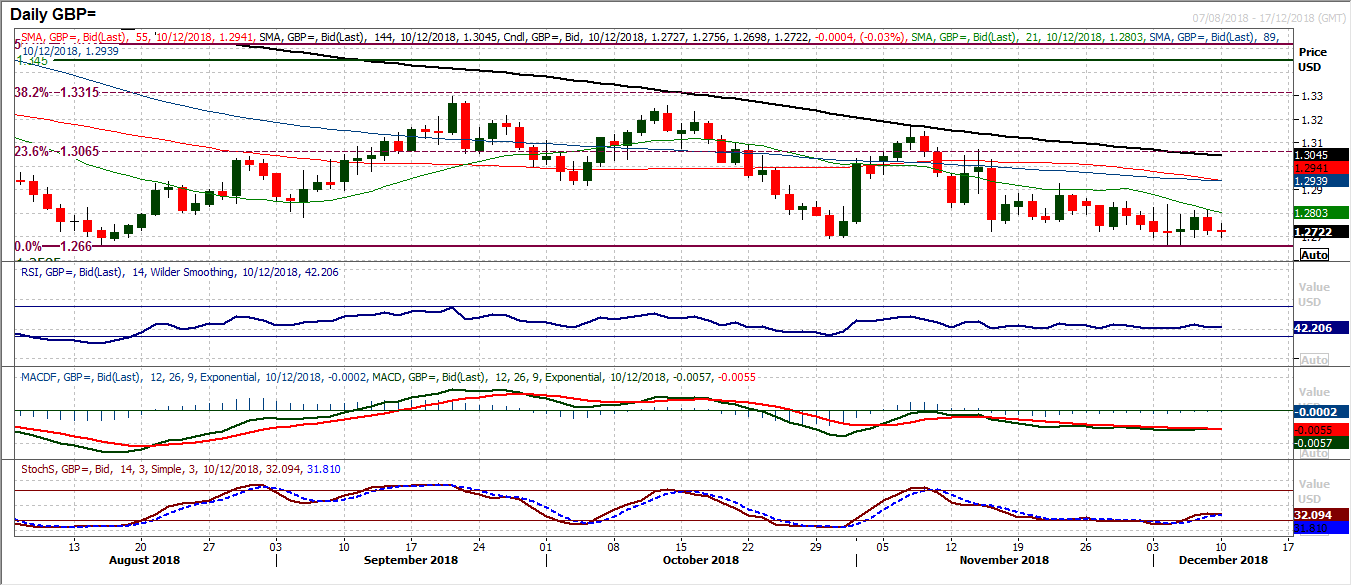
Whilst Brexit fever continues to grip the UK, sterling remains sluggish. Cable has been unable to drive any recovery traction even as the dollar has started to weaken across the majors. Every time there is a hint of recovery the sceptical market just takes profits and looks towards the next headline driven move. Once more on Friday the market failed to hold a move above $1.2800, something seen in each of the past seven sessions. The downtrend of the past three weeks may now have been broken but this is purely down to consolidation rather than a threatening recovery. Until the politics become clearer the sterling bulls will remain shackled. Support at $1.2660 is holding though and there does seem to be a floor in place, but with the potential volatility of Tuesday evening’s vote in Parliament, traders will be unwilling to take a view. Technicals have become an irrelevance, but they have also become increasingly flat.
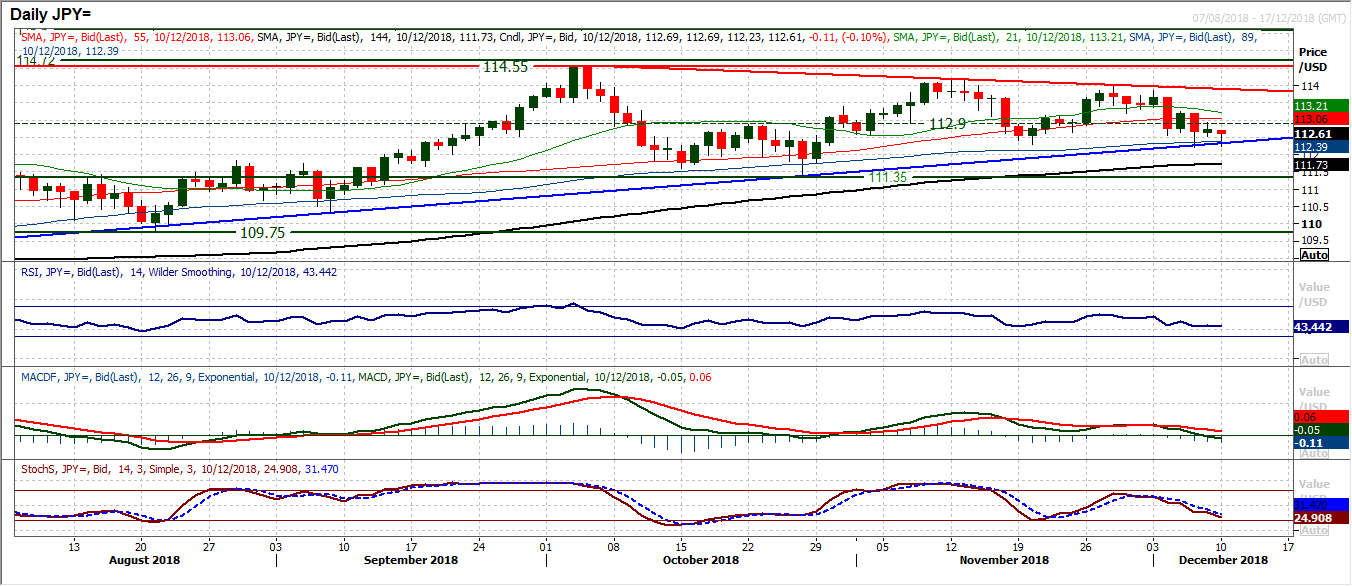
There has been limited direction out of the payrolls report, but the increasingly corrective outlook on Dollar/Yen is still threatening. A small positive candle on Friday has not inspired the dollar bulls and with the risk aversion of today’s session, the market is falling back again early this morning. There is still the deterioration in the momentum indicators which suggests the market is still gravitating around the crossroads of the medium term outlook. The market is testing the support of the six month uptrend (around 112.33 today) and the support of the 89 day moving average (112.38) as the past two weeks has seen a run of rallies fading at lower levels and pressure on support. The near term pivot around 113.20 is resistance now to watch. A close below 112.30 would confirm a six week low, a key deterioration and open 111.35. The hourly chart shows a recent downtrend formation, rallies failing around 50/60 on the hourly RSI and around neutral on the MACD lines which suggests the outlook is selling into strength.
Gold
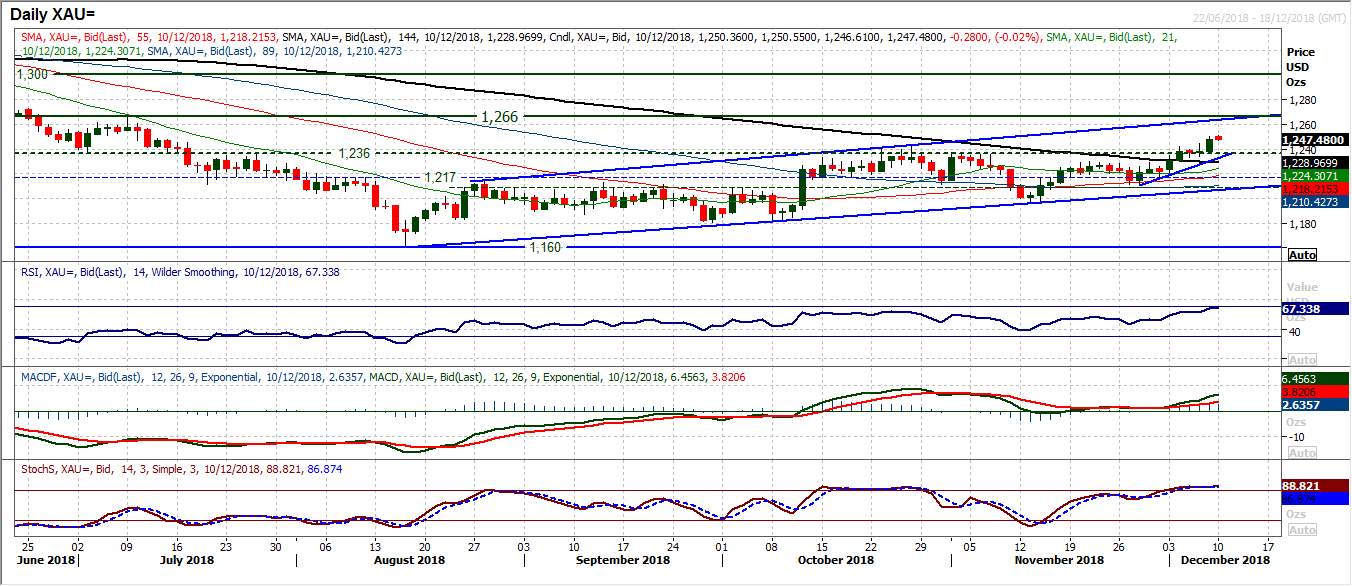
Gold continues to climb as the breakout above the old $1236 long term pivot is progressing to multi-month highs. With the strength of momentum indicators growing, this seems to be a rally to back now. The RSI is now into the high 60s which is the highest since January whilst the MACD and Stochastics are also rising strongly in positive configuration now. The pivot is supportive back at $1236 but the upside momentum generated in recent days means that the market is progressing steadily towards the top of the uptrend channel at $1264 today and the next resistance at $1266. (the next old rally high from July). Near term/intraday corrections are increasingly seen to be a chance to buy on gold with the hourly chart showing a band of mini breakout support $1241/$1244. There is also an eight day mini uptrend which is supportive around $1233 today.
WTI Oil
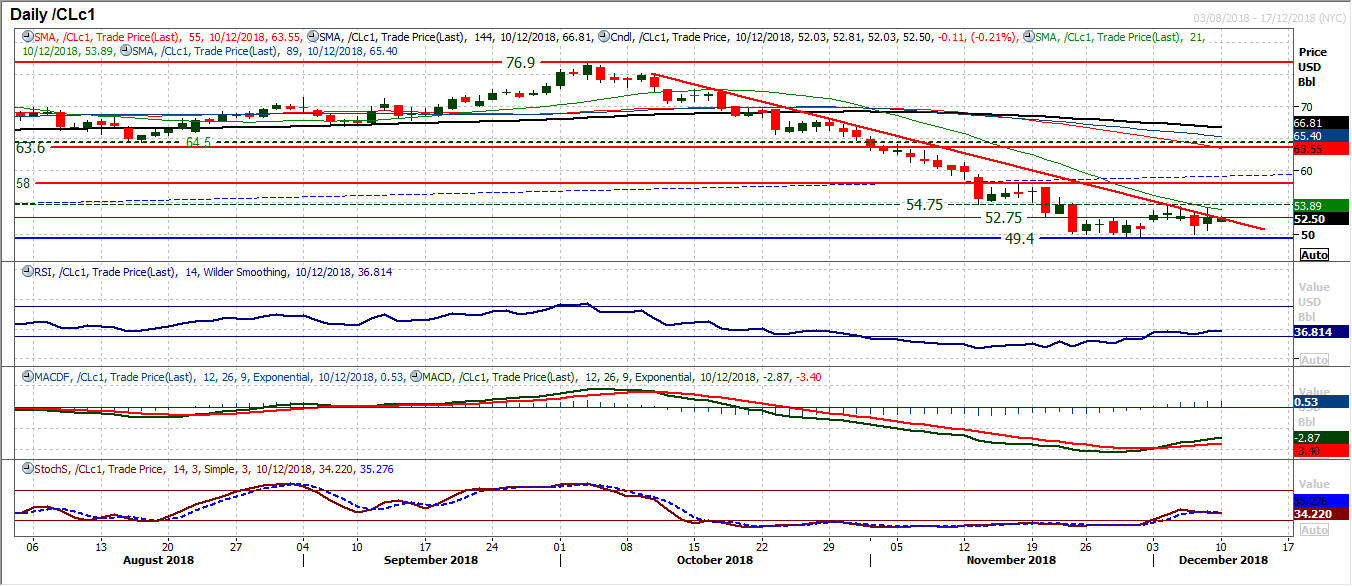
It will be interesting to watch the oil price in the coming days now, after the agreement to cut production by 1.2m barrels per day by OPEC+ (OPEC plus friends such as Russia). This seemed to be not far off the minimum needed (perhaps 1.5m needed). It seems as though there may now be a basis of a floor in place (or at least in the process of one forming). This comes with Friday’s mildly positive candle which may not have closed around the highs of the day, but which has begun to break the downtrend of the past eight weeks. The improvement in momentum indicators is now important with the MACD lines tracking higher and the RSI holding above 30. Resistance overhead is a problem though, with the pivot at $54.75 an increasingly important barrier overhead. The support of the psychological $50 level will also build one more above the $49.40 low from late November. The hourly chart shows a very mixed near term outlook, with uncertainty throughout the moving averages and momentum indicators. Support today initially with a minor pivot around $52.00 with resistance at Friday’s high of $54.20.
Dow Jones Industrial Average
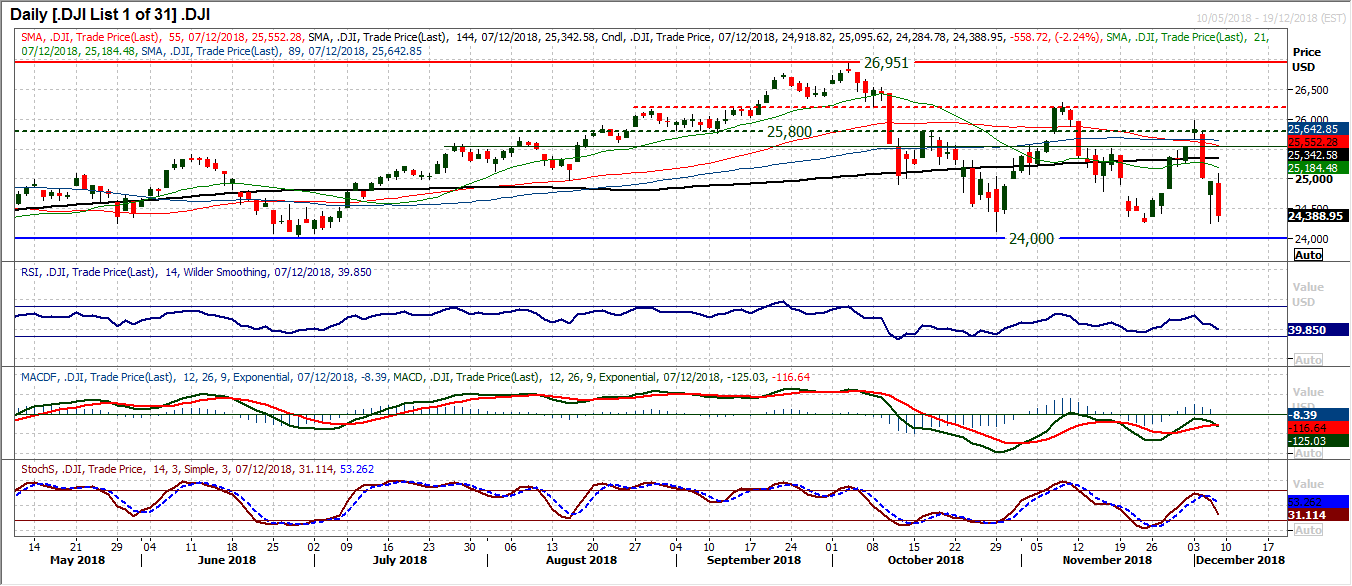
The fear was that Thursday’s huge rebound into the close was not actually a reflection of a bull recovery, more that the market is now beset with volatility that will drive wild swings. An so, on Friday once more, a huge range in the session has seen the market sharply back lower again. Bearishly filing a downside gap, leaving resistance at 25,095 and now ready to test the key November low at 24,269. Since May there have been four major lows in the range 24,000/24,270 so this is a key moment for the Dow. Momentum indicators have turned negative once more and with further downside potential, if this band of support breaks, the downside towards the crucial lows at 23,345 are open.
Author

Richard Perry
Independent Analyst


