DJI

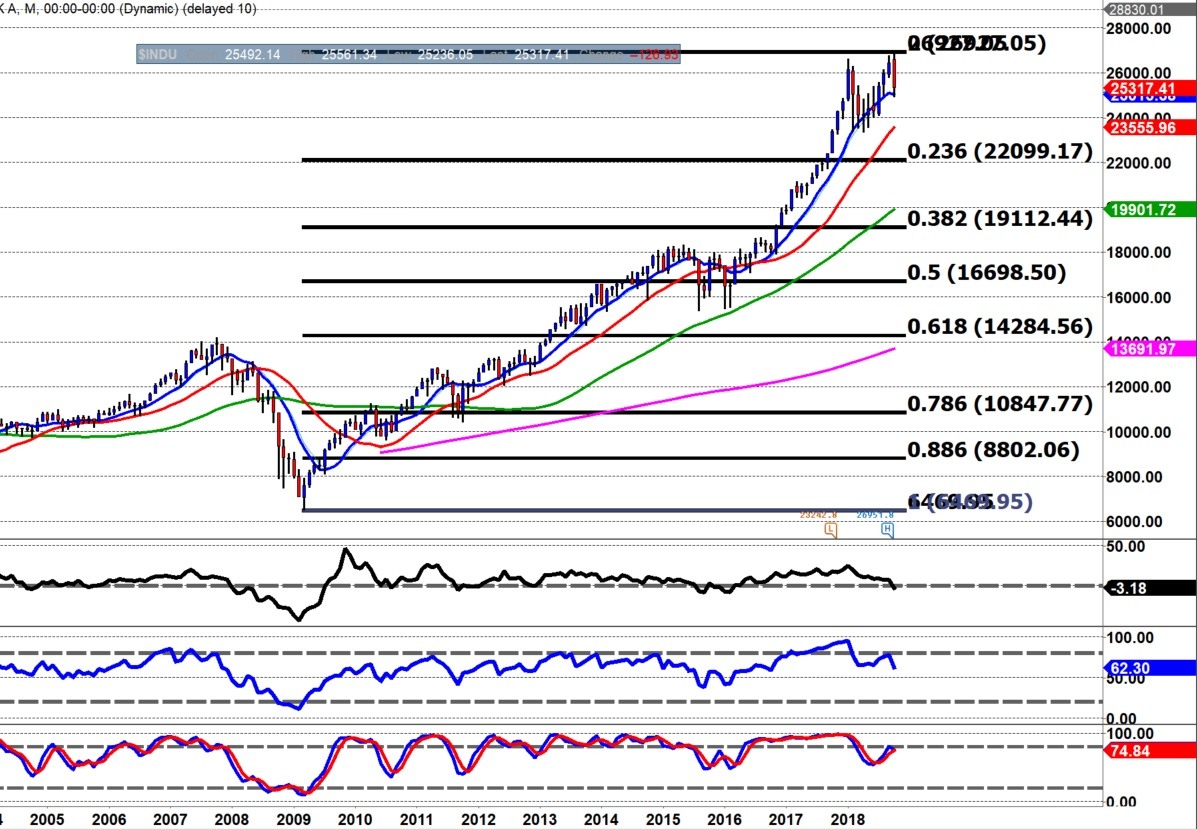
If you never look at another chart I send, please look at this one...It is the monthly DJI.... Strong uptrend since 2009....very steep uptrend since 2016...then this year ..no....it stalled at the beginning of the year...Now as I stated then I expected that leg lower to be like 2016...a bear correction to a bullish trend...True to form.. DJI recovered and went on the post new ATHs...Now this is where it gets interesting...On the very day it posted the ATH.. it closed at the lows...huh....why would it do that said my little brain as I scrambled to sell S&P and FTSE.....Now as the month has progressed we have an unprecedented phenomenon...The DJI is actually going to post a reversal Month from its ATHs...The monthly indicators I look at have all, every one of them turned negative...and the stochastics that was showing overbought since 2016 has turned lower from really quite neutral levels...Now...what does this tell us...well it tells me...alerts me to the fact that the DJI along with all other stock markets are not just having a bear market correction...this price action is conducive with a complete change of trend...have we seen this before...Of course we have seen changes of trend....but nothing like this one will be...and typically end of trends see wild swings in ranges...well...we have truly experience that this year...then to end on a key reversal month....encompassing the ATH is a technical traders dream...The writing is on the wall for this bay...let me tell you....and also this is a funny thing...If the Fed want to hike what better way of achieving this than having a bear market DJI....they can raise rates to support it....quickly...which is a bit different to the usual 1/4% they may or may not do....but these things never pan out as planned...so the fed could be busy the rest of this year...and into next year....To post ATHs and reverse the same month is something I have not seen in any of the markets I look at in 37 years.....So this is a sit up and take notice report....This is going lower...and its going lower a lot...I believe that even keeping the long term uptrend intact the market could easily go down to 19900/19112 without too much bother...and it would still be higher than the highs of 2015....so lets get things into perspective......Every single thing on this longer term cart points to a crash....exceeding the one early on in the year....we may find support around 23555...but more like 22099 the first attempt...bit of correction then 19900 here come with 19112 following.....an b ounce from current levels of the close of last night should find resistance at 25924 to 25976 and this is where we start to build our short DJI position...or we sell a break of 24870...either way we want to be short....

DJI

The research provided by Charmer Charts is provided solely to enable clients to make their own investment decisions and does not constitute personal investment recommendations. No recommendations are made directly or indirectly by Technicalanalysisreports.com or Charmer Charts as to the merits or suitability of any investment decision or transaction that may result directly or indirectly from having viewed the technical analysis investment research. Customers are therefore urged to seek independent financial advice if they are in any doubt. The value of investments and the income derived from them can go down as well as up, and you may not get back the full amount you originally invested. Derivatives and foreign exchange trading are particularly high-risk, high-reward investment instruments and an investor may lose some or all of his or her original investment. Also, if you decide to acquire any investment denominated in a different currency you should note that changes in foreign exchange rates may have an adverse effect on the value, price and income of the investment in your own currency. Technicalanalysisreports.com or Charmer Charts shall not be liable for any direct or indirect, incidental or consequential loss or damage (including loss of profits, revenue or goodwill) arising from the use, inability to use, interruption or non-availability of the technical analysis investment research or any part of the research materials published or otherwise any loss of data on transmission, howsoever caused. Whilst the research material published is believed to be reliable and accurate, it is not independently verified. Accordingly, no representation or warranty is made or given by Technicalanalysisreports.com or Charmer Charts, its officers, agents or employees as to the accuracy or completeness of the same and no such person shall have liability for any inaccuracy in, or omission from, such materials.

Recommended Content


Recommended Content

Editors’ Picks

AUD/USD hovers around 0.6500 amid light trading, ahead of US GDP

AUD/USD hovers around 0.6500 amid light trading, ahead of US GDP

AUD/USD is trading close to 0.6500 in Asian trading on Thursday, lacking a clear directional impetus amid an Anzac Day holiday in Australia. Meanwhile, traders stay cautious due ti risk-aversion and ahead of the key US Q1 GDP release. 

AUD/USD News

USD/JPY finds its highest bids since 1990, near 155.50

USD/JPY finds its highest bids since 1990, near 155.50

USD/JPY keeps breaking into its highest chart territory since June of 1990 early Thursday, testing 155.50 for the first time in 34 years as the Japanese Yen remains vulnerable, despite looming Japanese intervention risks. Focus shifts to Thursday's US GDP report and the BoJ decision on Friday. 

USD/JPY News

Gold price lacks firm intraday direction, holds steady above $2,300 ahead of US data

Gold price lacks firm intraday direction, holds steady above $2,300 ahead of US data

Gold price remains confined in a narrow band for the second straight day on Thursday. Reduced Fed rate cut bets and a positive risk tone cap the upside for the commodity. Traders now await key US macro data before positioning for the near-term trajectory.

Gold News

Injective price weakness persists despite over 5.9 million INJ tokens burned

Injective price weakness persists despite over 5.9 million INJ tokens burned

Injective price is trading with a bearish bias, stuck in the lower section of the market range. The bearish outlook abounds despite the network's deflationary efforts to pump the price. Coupled with broader market gloom, INJ token’s doomed days may not be over yet.

Read more

Meta Platforms Earnings: META sinks 10% on lower Q2 revenue guidance Premium

Meta Platforms Earnings: META sinks 10% on lower Q2 revenue guidance

This must be "opposites" week. While Doppelganger Tesla rode horrible misses on Tuesday to a double-digit rally, Meta Platforms produced impressive beats above Wall Street consensus after the close on Wednesday, only to watch the share price collapse by nearly 10%.

Read more

Majors

Cryptocurrencies

Signatures