|

DJI 30 price swings and waves before US elections

  • This article reviews the potential ABC (orange) correction and how deep the retracement can go with the U.S. Presidential elections around the corner.

  • A strong bullish bounce (blue arrow) could confirm the uptrend. A bear flag (green arrow) could indicate more downside.

  • Once price breaks below the 38.2% Fib, then there is substantial bearish space (red box) for a significant move lower towards the 78.6% Fib.

The Dow Jones Index (DJI 30) tested the previous top… but price action was unable to break it.

US30

Price Charts and Technical Analysis

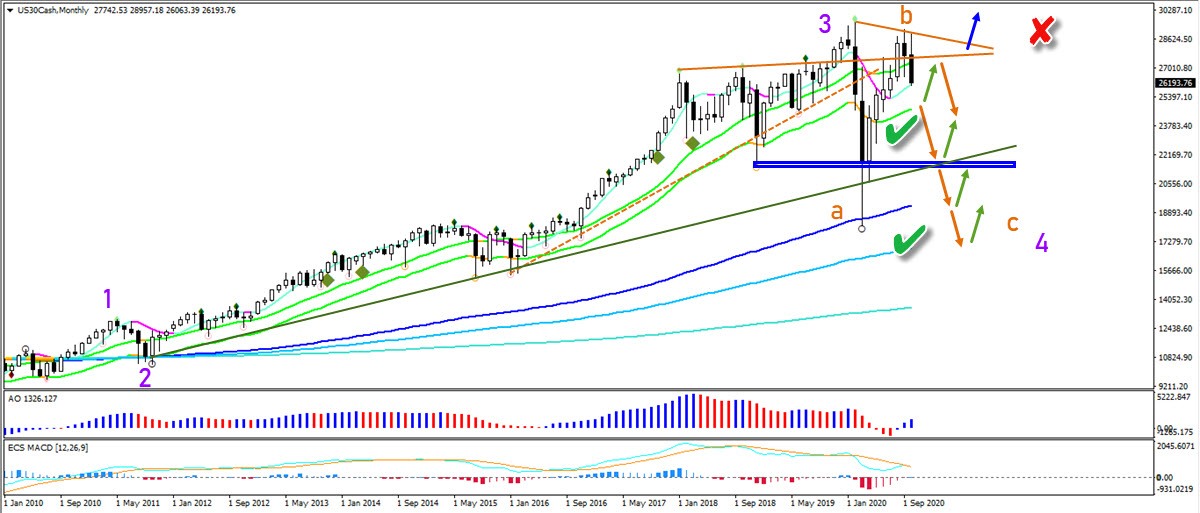
DJI 30 is showing two bearish monthly candles in a row. This could confirm a bearish bounce. Plus the end of the wave B (orange).

The start of the wave C (orange) is confirmed once price action is able to break below (orange arrow) the 21 ema zone. The first target is the support zone (blue box). 

A second bearish breakout could indicate an even deeper retracement towards the previous bottom and long-term moving averages. Only a break (blue arrow) above the resistance invalidates (red x) the bearish ABC pattern.

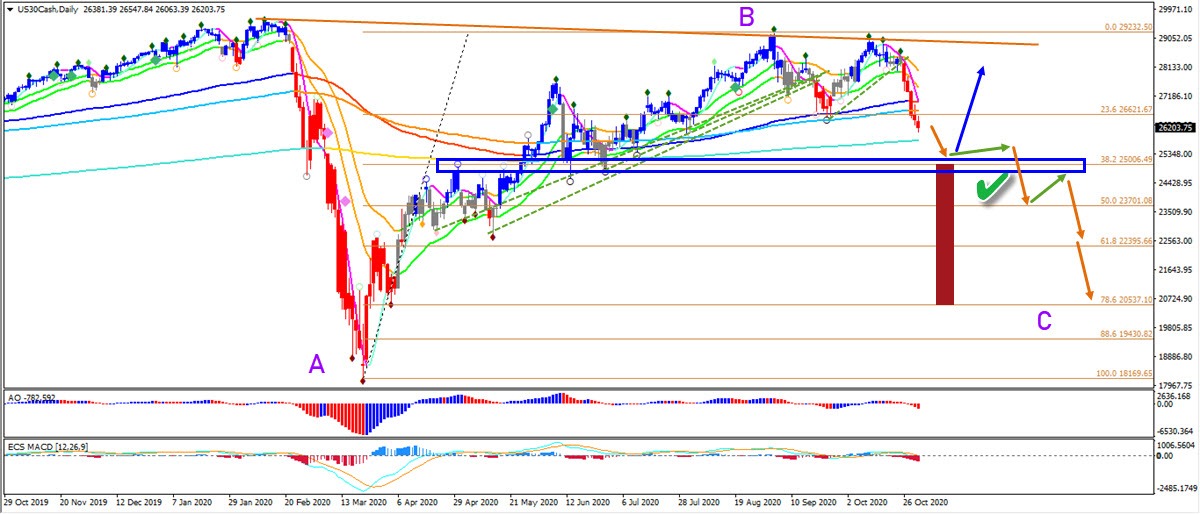
On the daily chart, price action is still above the shallow 38.2% Fibonacci retracement level. This means that bears should still be very careful of this Fib and the support zone.

A strong bullish bounce (blue arrow) could confirm the uptrend. A bear flag (green arrow) could indicate more downside. 

Once price breaks below the 38.2% Fib (green check), then there is substantial bearish space (red box) for a significant move lower towards the 78.6% Fib.

US30

The analysis has been done with the ecs.SWAT method and ebook.

Author

Chris Svorcik

Chris Svorcik

Elite CurrenSea

Experience Chris Svorcik has co-founded Elite CurrenSea in 2014 together with Nenad Kerkez, aka Tarantula FX. Chris is a technical analyst, wave analyst, trader, writer, educator, webinar speaker, and seminar speaker of the financial markets.

More from Chris Svorcik
Share:

Editor's Picks

EUR/USD flat lines around 1.1900; looks to US NFP report for fresh directional impetus

The EUR/USD pair is seen oscillating in a narrow trading band around the 1.1900 mark during the Asian session on Wednesday as traders opt to wait for the release of US monthly employment details before placing fresh directional bets.

GBP/USD recovers losses despite rising UK political risks, BoE rate cut bets

Pound Sterling advances against the US Dollar after registering modest losses in the previous session, trading around 1.3650 during the Asian hours on Wednesday. The pair could extend losses as the Pound Sterling faces pressure from rising political risks in the UK and growing expectations of near-term Bank of England rate cuts.

Gold awaits US Nonfarm Payrolls data for a sustained upside

Gold remains capped below $5,100 early Wednesday, gathering pace for the US labor data. The US Dollar licks its wounds amid persistent Japanese Yen strength and potential downside risks to the US jobs report. Gold holds above $5,000 amid bullish daily RSI, with eyes on 61.8% Fibo resistance at $5,141.

Bitcoin, Ethereum and Ripple show no sign of recovery

Bitcoin, Ethereum, and Ripple show signs of cautious stabilization on Wednesday after failing to close above their key resistance levels earlier this week. BTC trades below $69,000, while ETH and XRP also encountered rejection near major resistance levels. With no immediate bullish catalyst, the top three cryptocurrencies continue to show no clear signs of a sustained recovery.

Dollar drops and stocks rally: The week of reckoning for US economic data

Following a sizeable move lower in US technology Stocks last week, we have witnessed a meaningful recovery unfold. The USD Index is in a concerning position; the monthly price continues to hold the south channel support.

XRP holds $1.40 amid ETF inflows and stable derivatives market

Ripple trades under pressure, with immediate support at $1.40 holding at the time of writing on Tuesday. A recovery attempt from last week’s sell-off to $1.12 stalled at $1.54 on Friday, leading to limited price action between the current support and the resistance.