DAX: Consolidation phase could lead to a further upside in the short term
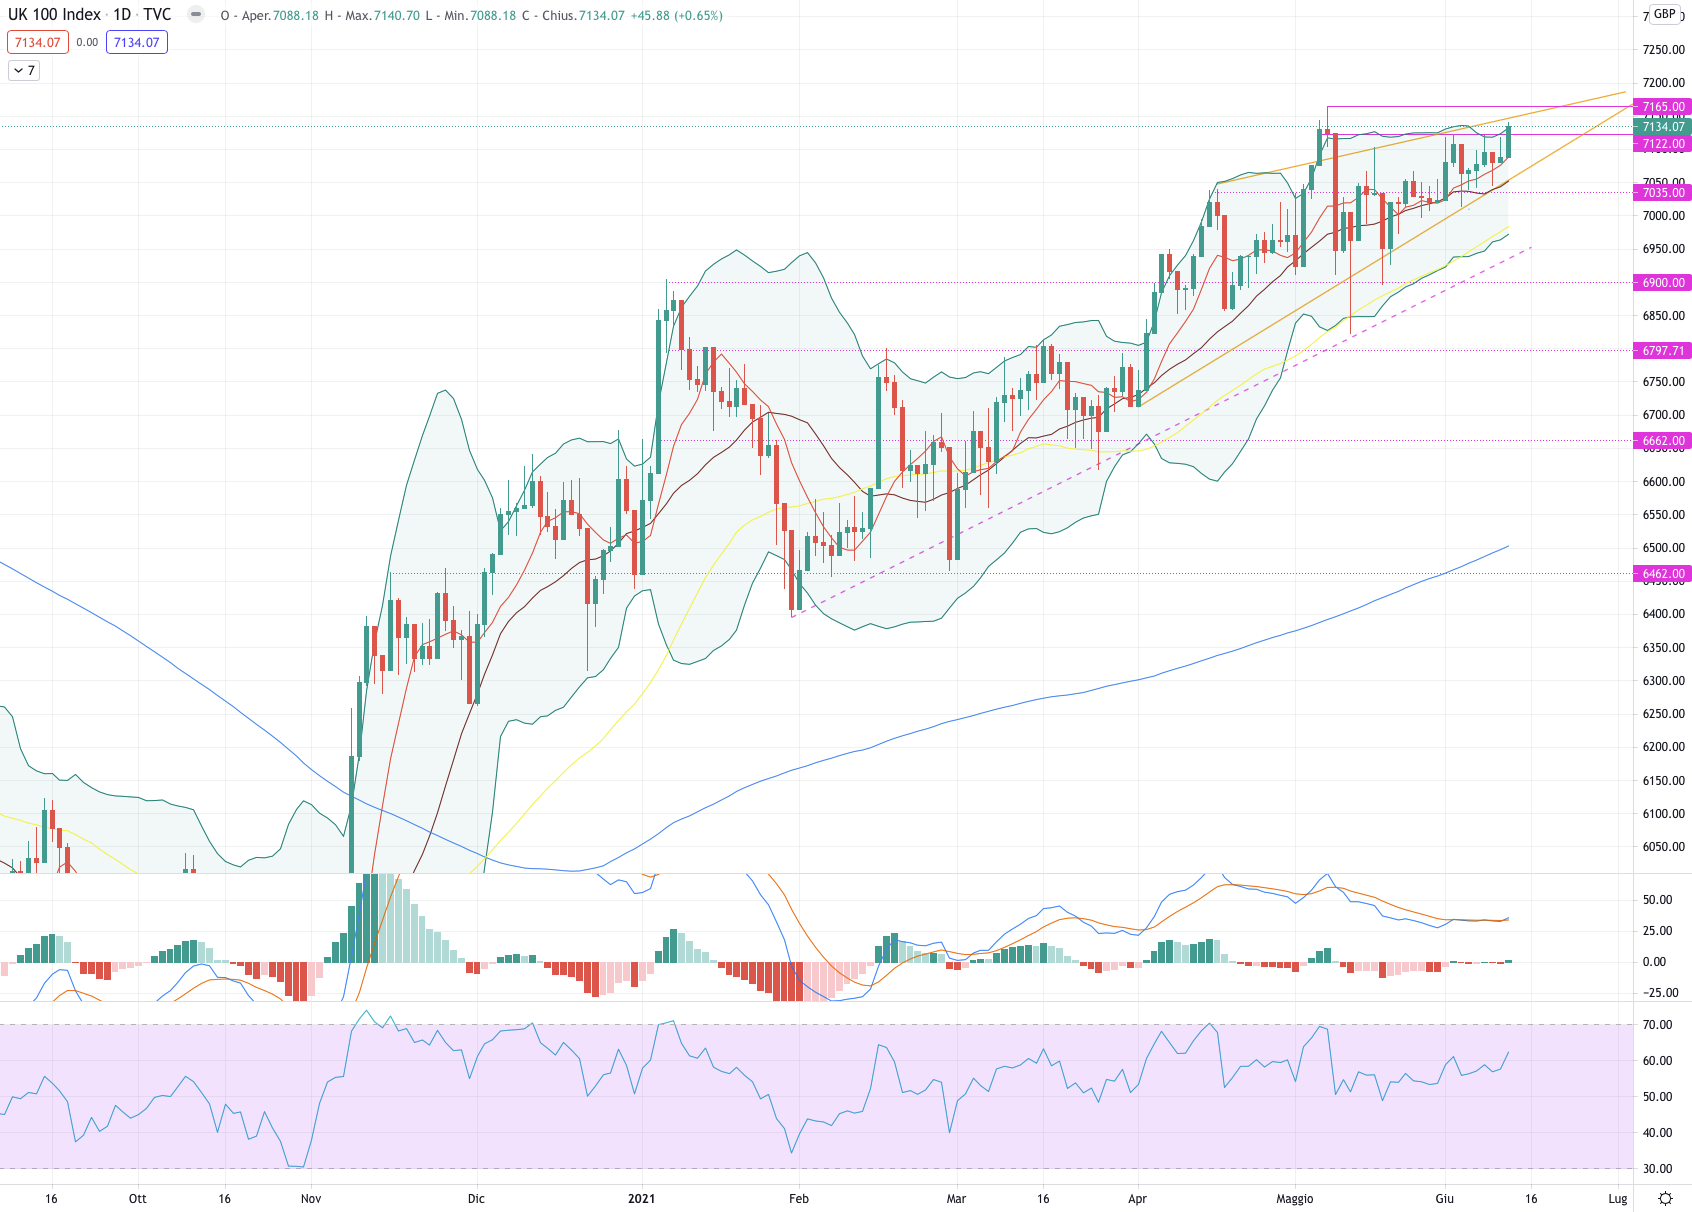
FTSE 100 (#UKX)
The FTSE 100 had a positive week up + 0.89%.
For the coming week, the index could retest 7,100-7,060 and then proceed upwards to 7,165.
Indicators
MACD and RSI, despite the positive week did not register strong changes: MACD is slowly crossing to the upside and the RSI has instead a slight divergence with the price.
The breaking of the previous resistance is certainly a positive sign: however, we prefer to wait for an entire candle above 7.122 to confirm a bullish momentum.
Before further bullish moves, we expect a re-test of 7,100; it should be noted that a non-rebound could bring the index up to 7.060, below the 9-day average and on the lower trendline of the bearish wedge.
Support at 7,122.
Resistance at 7.165.
FTSEMIB (#FTSEMIB)
The FTSEMIB had a positive week up + 0.66%.
For the week ahead, we expect a consolidation of between 25,500 and 25,800 given the strong bullish momentum of the previous weeks.
Indicators
MACD is signaling a possible bearish crossover and the RSI, having left the overbought zone, still has a strong divergence with the price of early April 2021.
We believe that the index may now consolidate between 25.500 - 25.800: the break of one of the two levels could lead the FTSEMIB to test support or resistance.
Support at 25.223.
Resistance at 26,000.

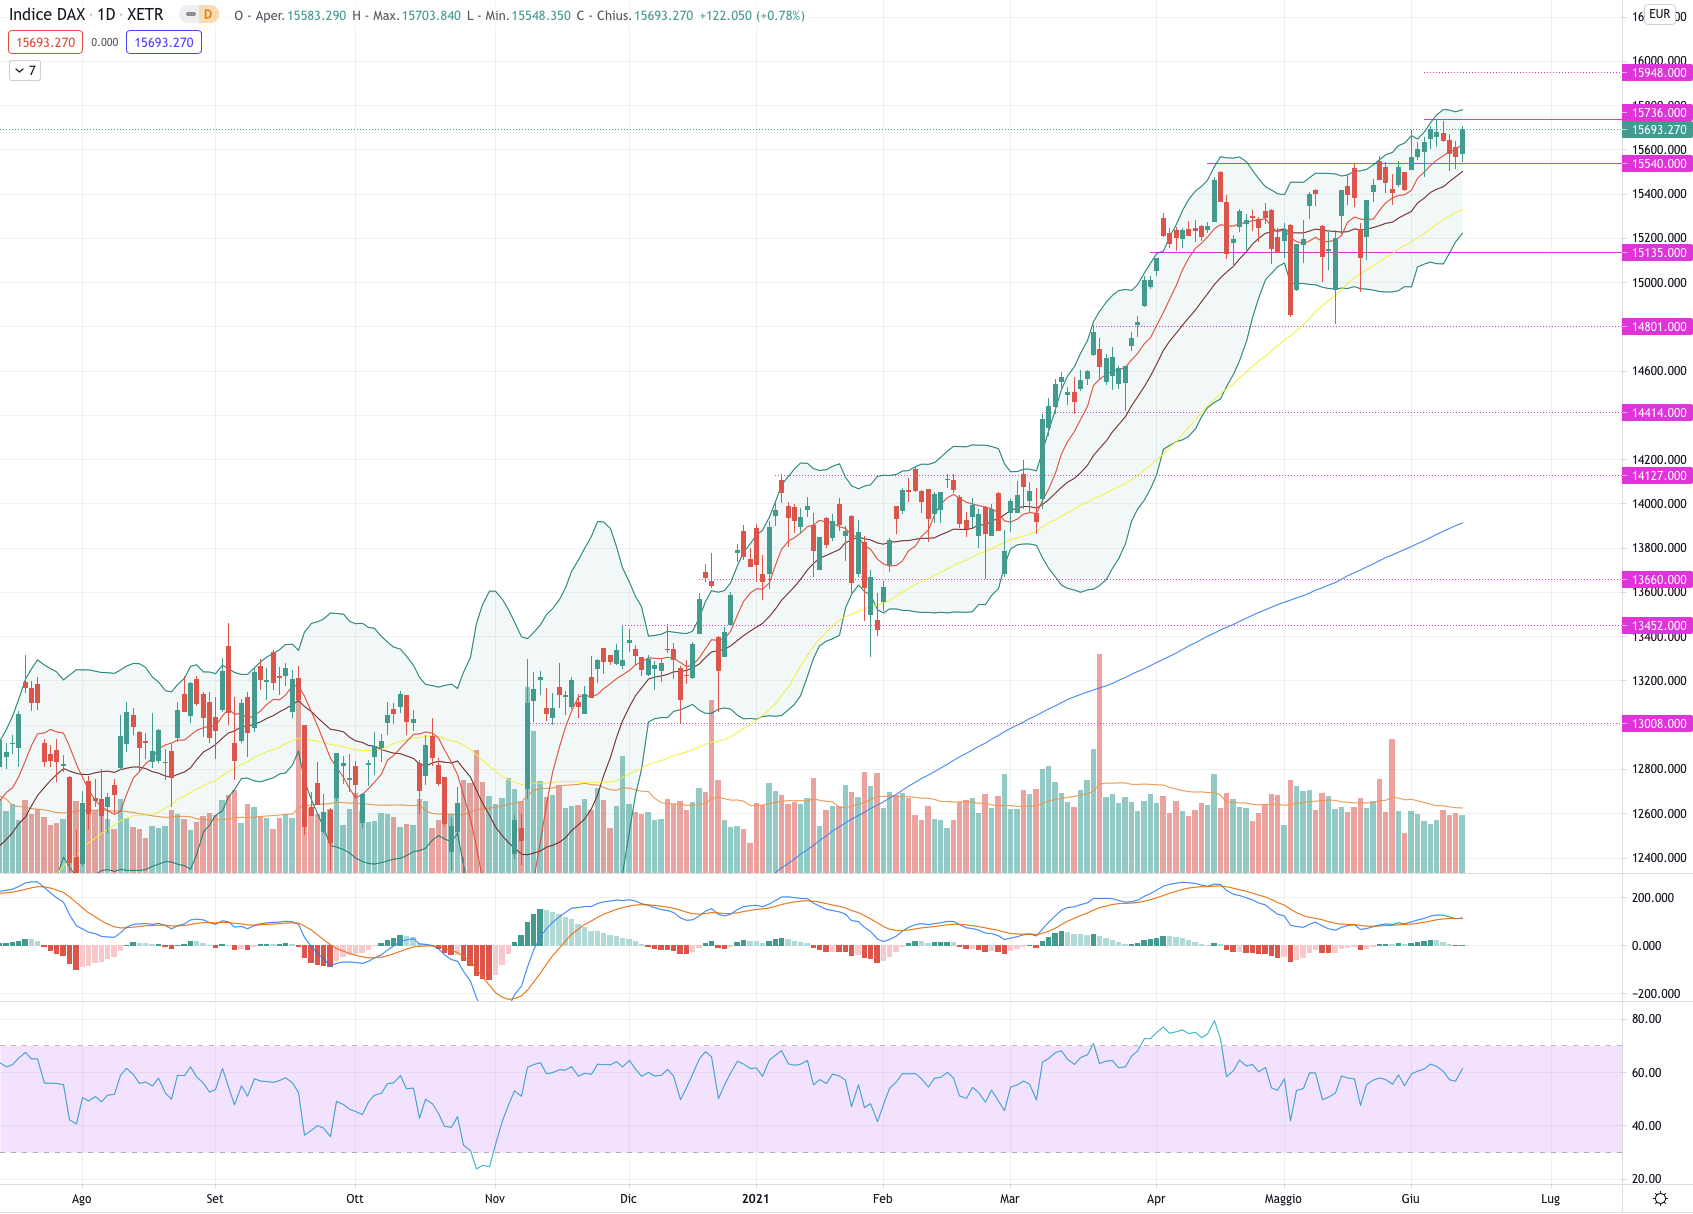
DAX (#DAX)
The DAX ended the week with a slight gain of + 0.24%.
For the week we expect a continuation of the bullish momentum, however, going first to test 15.630 and then continue rising up to 15.736.
Indicators
MACD and RSI were broadly flat during the week, thus mirroring the #DAX consolidation.
Given the strong uptrend, this consolidation phase could lead to a further upside in the short term: however, we prefer to wait for the break of support or resistance to confirm future targets.
Support at 15,540.
Resistance at 15.736.
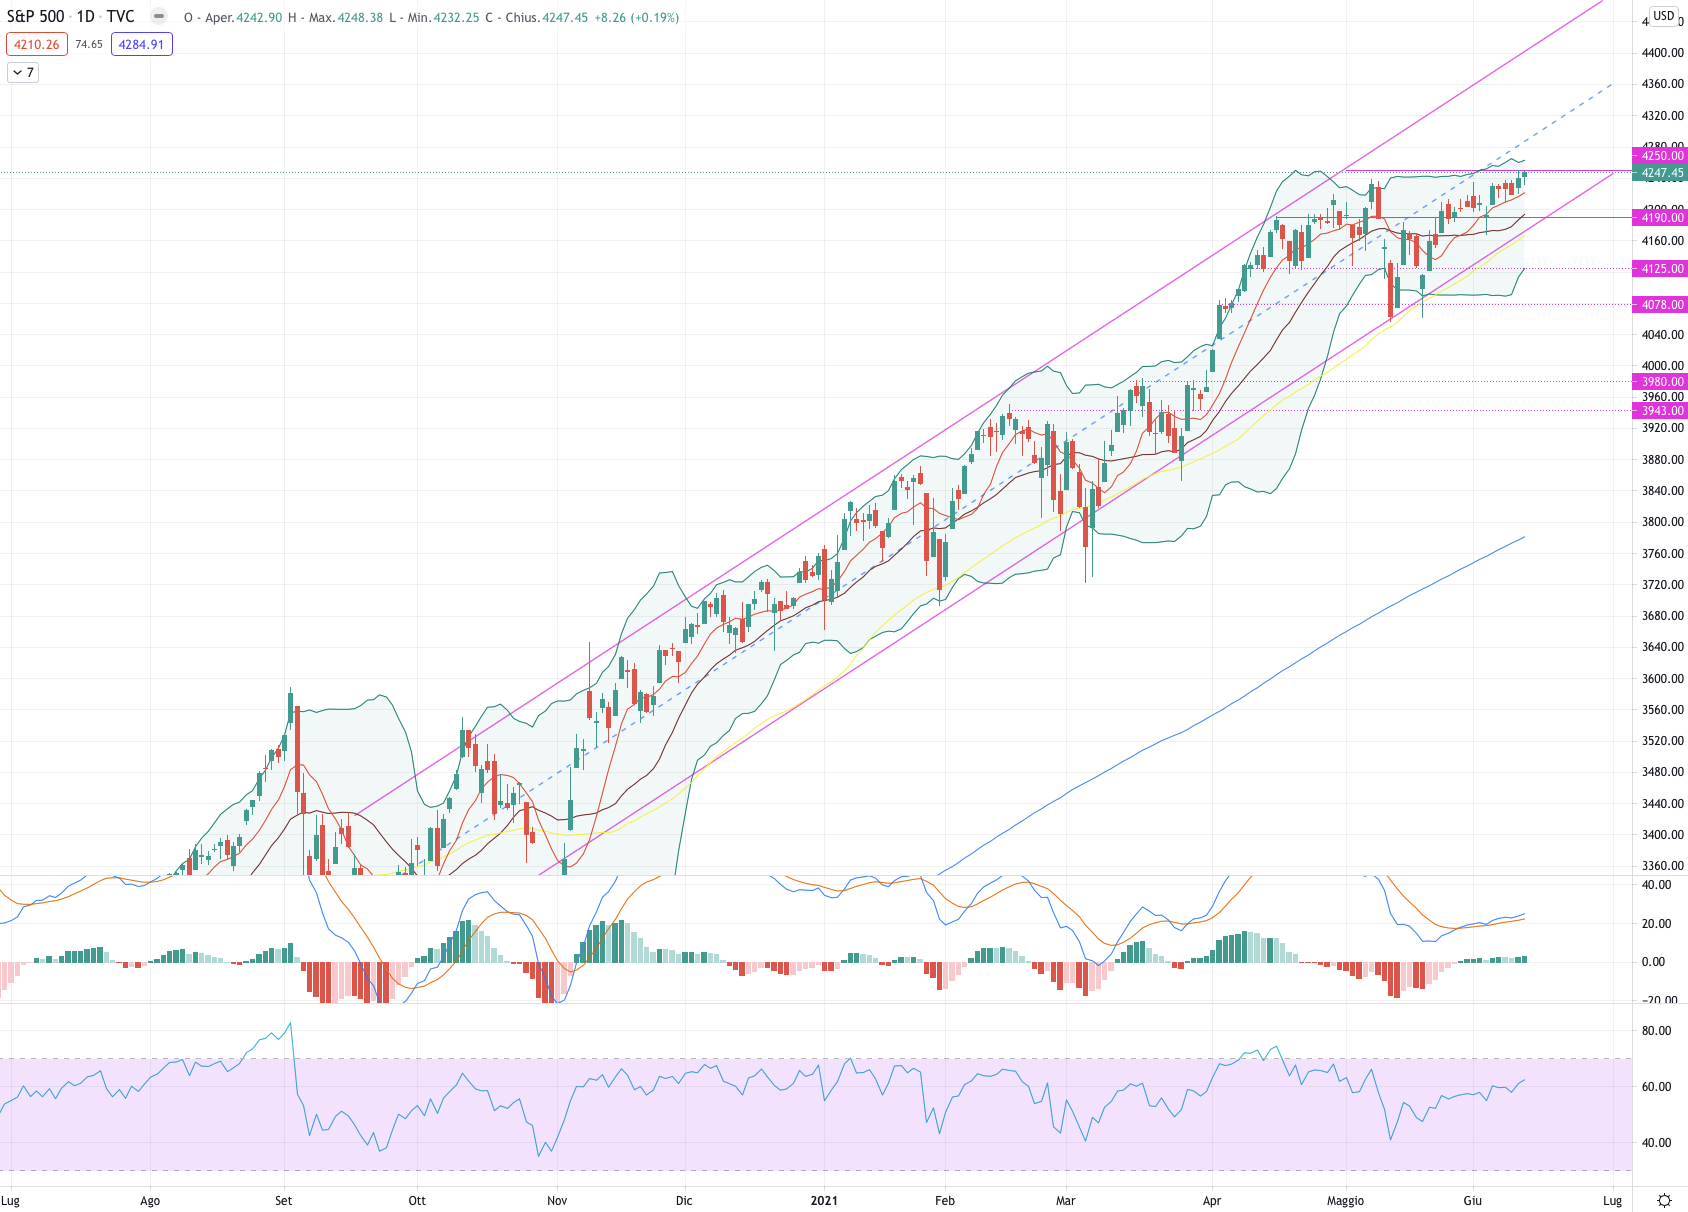
S&P500 (#SPX)
The S&P 500 had a positive week up + 0.39%.
For the coming week, we expect the index to slighlty decline to 4.220 and then to consolidate between that level and 4.250.
Indicators
The MACD has been fairly flat throughout the week, coupled with an RSI still diverging sharply with the price.
These two indicators are not offering the strength that would be expected at an index almost at an all-time high: for this reason, we expect a consolidation between the 9MA and the current resistance.
Support at 4.190.
Resistance at 4.240.
Nasdaq 100 (#NDX)
The NASDAQ had a positive week up + 1.86% reaching our target of 13.950.
For the week ahead, we expect a slight decline to 13,800 and then continue higher to 14,000.
Indicators
The MACD is signaling a strong bullish moment supported by a strong RSI - both indicators support the NASDAQ bullish trend.
However, we expect a slightly bearish start to the week: the distance from the 9MA is suggesting a slight decline to then continue the uptrend.
Support at 13,540.
Resistance at 14.047.

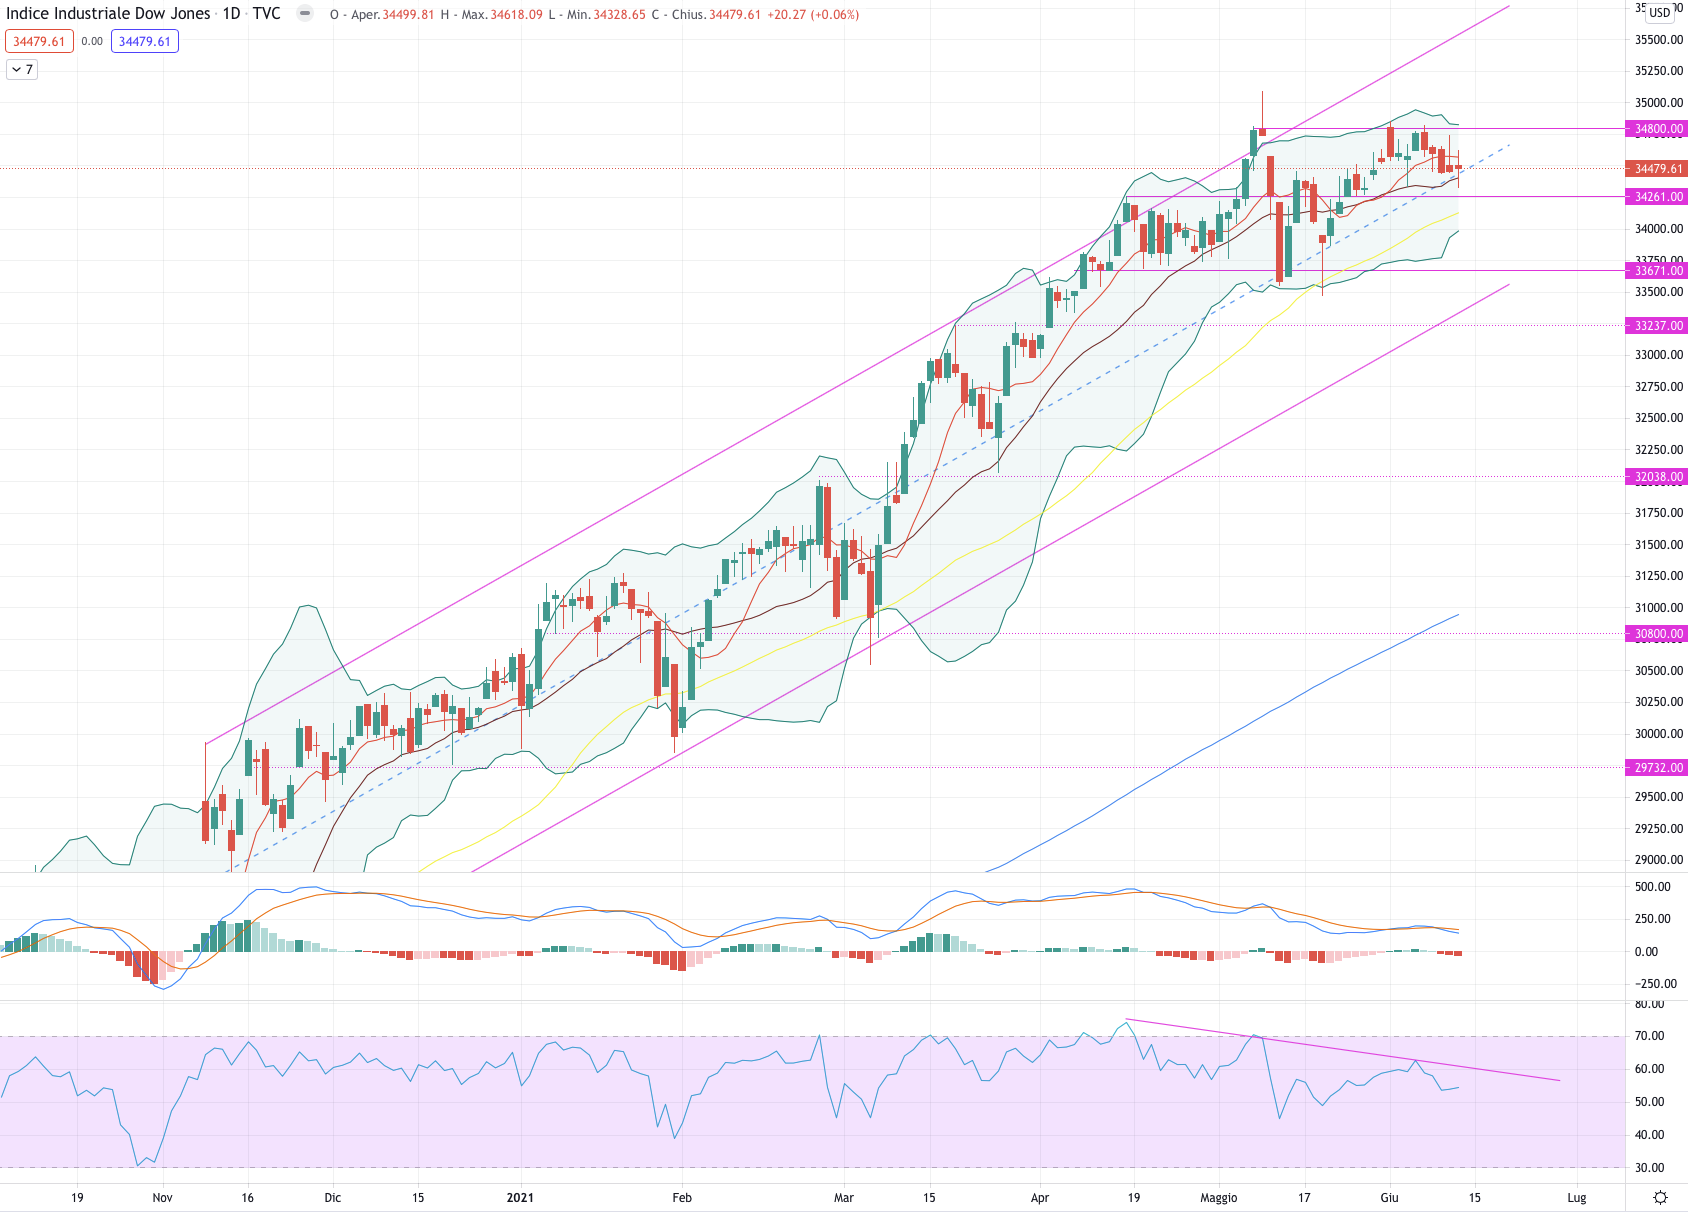
Dow Jones (#DJI)
The DOW JONES had a week down by -0.91%.
For the short term we are in favor of a bearish continuation to 34.261.
Indicators
The MACD recently crossed to the downside confirming the bearish moment. RSI is in slight divergence with the price, as the oscillator is clearly down while the index is having parallel fluctuations.
Before continuing the uptrend, the #DJI could test the current support.
Support at 34.261.
Resistance 34,800.
Author

Francesco Bergamini
OTB Global Investments
Francesco, BSc Finance and Msc in Business Management, graduated with Merit, is a professional with experience in the financial services industry and a keen interest in the financial markets.


