Dark clouds loom with Trump and Hong Kong protests biting sentiment

Market Overview
A general mood of risk aversion has crept back into major markets in recent days. There has not been one stand out event as the driving factor, but Trump’s constant comments about trade tariffs are leaving traders notably more cautious again. Not content with jabbing at China and Mexico, Trump is now turning attention to Europe again, with threats of prospective sanctions on Germany over the development of the Nord Stream 2 gas pipeline from Russia. Added to the concerns in Asia over the protests in Hong Kong, this is pulling traders back towards safe haven plays again. Gold and the yen are strengthening again, whilst bond yields are falling and equities ticking lower. With the oil price having also move into decline from the concerns over retracting demand growth, there is an air of darkening clouds once more. Australian unemployment held up at 5.2% (5.1% exp, 5.2% last% last), with the participation rate maintaining at 66.0%, however, in this current glass half empty market, it is seen as a chance to sell the Aussie again.

Wall Street closed slightly lower last night with the S&P 500 -0.2% at 2880. With US futures again slipping back by -0.2%, Asian markets are under pressure (Nikkei -0.6%, Shanghai Composite +0.1%). European markets are also weaker in early moves, with the FTSE futures and DAX futures both around -0.2% lower. In forex, there is a risk negative bias, with JPY and CHF again outperforming, whilst AUD is under pressure again. In commodities, with the risk negative outlook this is helping gold to find support, whilst oil has found support this morning on reports of an incident with an oil tanker in the Sea of Oman suggesting potential supply disruptions.
Early in the European session there will be a look at Swiss National Bank monetary policy, with rates expected to be held at -0.75%, however, watch for any easing bias in the outlook. At 1000BST the Eurozone Industrial Production is expected to fall by -0.4% on the month (after a -0.3% decline last month). US Weekly Jobless Claims are at 1330BST and are expected to once more be around similar levels at 215,0000 (218,000 last week).
Chart of the Day – GBP/AUD
Sterling may be stuck in a bit of a rut right now, but given the weakening of the Aussie, this means GBP/AUD is finding traction in a recovery. The technical are now pulling some key improvements. With the April low at 1.8095 holding firm, the cross has broken a five week downtrend with three successive bull candles completed this week. There has been a notable improvement in momentum too. Buy signals on the Stochastics and MACD lines (both forming bull crosses) and the RSI above 50 reflects the development of the recovery. The move is now well on course for a rebound to the key medium term pivot band 1.8400/1.8460. This is all very reminiscent of the mid-April recovery. Back in April, a very similar five week sell-off found momentum buy signals before a sharp recovery. An initial look at the pivot band could be restrictive but the bulls will be eyeing a continued recovery now. Given the strength of the momentum run, this look to be a strong move now. The hourly chart shows a small base pattern above 1.8270 implying 150 pips of recovery to 1.8420, with a band of support 1.8240/1.8270.

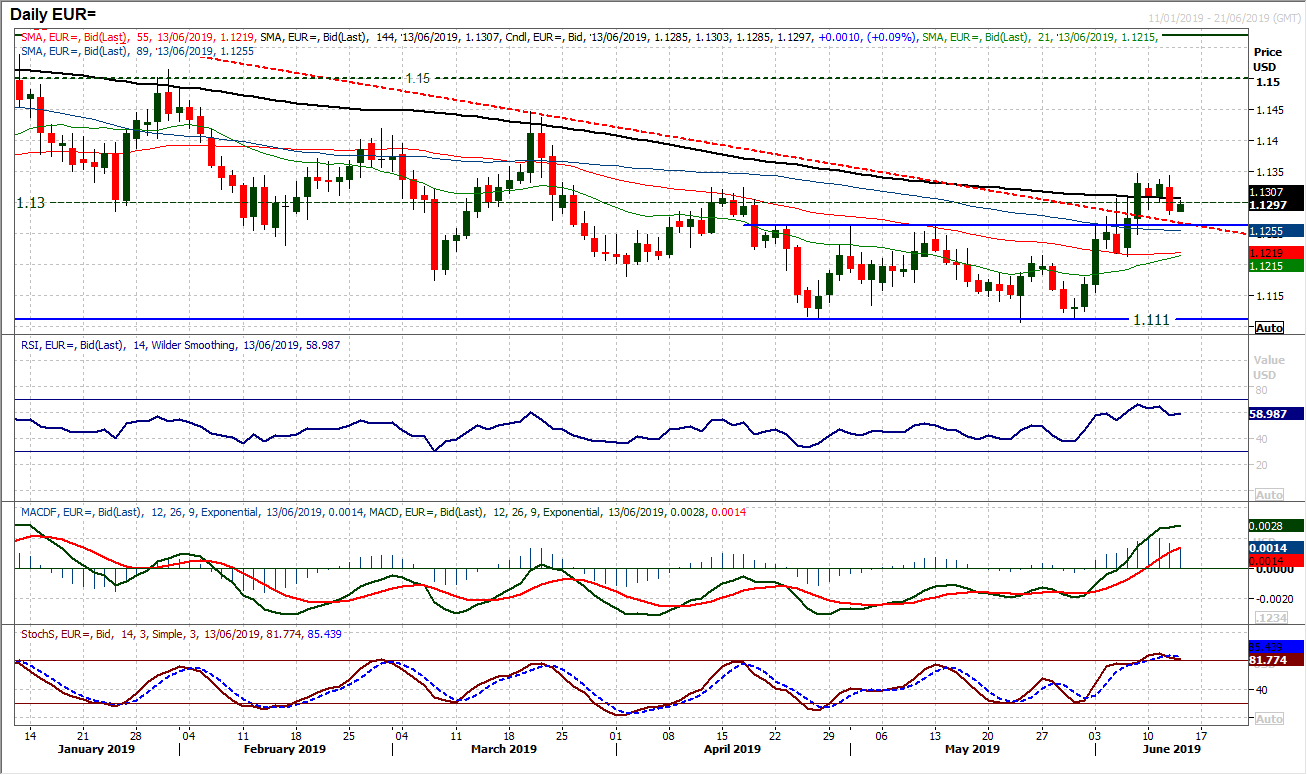
The strength of the euro bulls is now being tested. A bearish engulfing candlestick (a bear key one day reversal) puts a more negative spin on the near term consolidation. The breakout above $1.1265 was key last week, with added importance of a move above a medium term pivot at $1.1300. However, yesterday’s close below $1.1300 is a warning for the bulls. The breakout above the long term downtrend is now a basis of support along with the old resistance around $1.1265. If this support is breached then there is a far less positive outlook. For now it is a consolidation though, and today’s early reaction to find support is encouraging. However, if there is another negative close with a bear candle, then the momentum for a correction could build. Resistance at $1.1347 from last Friday has been in place all week and the warning signs are beginning to appear on the hourly chart. Hourly RSI slipping below 30 and MACD lines below neutral. If this continues then the prospect of a correction will grow.
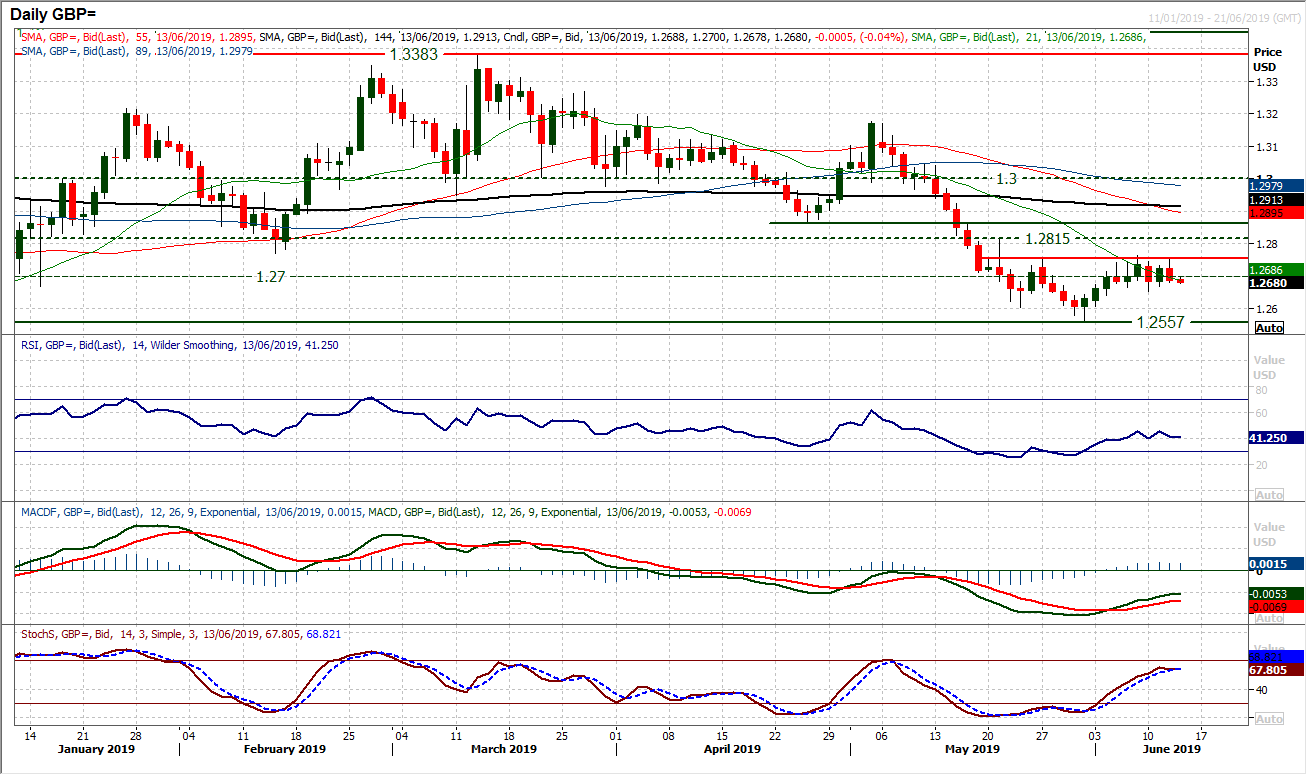
We recently discussed the prospect of a near term base pattern formation, however, the resistance around $1.2755/60 is strong and growing. Yesterday’s session saw an intraday test of the resistance which was repelled and the market rejected the move to close well back within the near term range of 110 pips again. A negative candle has put the bulls back in their pen once more. The hourly chart shows the near term range configuration continues. Oscillating between 30/70 on RSI with little real direction on MACD lines. A closing breach of $1.2650 support would be negative and re-open the $1.2555 low. A closing breach of $1.2760 resistance would complete a near term 200 pip base pattern. However, the consolidation is now into its eighth session and looking for direction.
The near term consolidation continues to play out as the market continues to form indecisive daily candlesticks at or around 108.50. The problem that the dollar bulls face is that this is all set out within the scope of a downtrend channel and if there were to be a decisive rally, they would have hoped to drive the market higher by now. Given the negative drift of lower highs on the RSI, whilst MACD and Stochastics remain negatively configured, it is difficult to see rallies as anything more than a chance to sell. The overhead negative indicators are bearing down, with the channel resistance at 109.15 today and the resistance of the falling 21 day moving average at 109.10. This week’s high at 108.80 and the hourly chart negative configuration is mounting. The hourly RSI is now struggling between 50/60 whilst MACD lines are below neutral. Initial support this morning around 108.15 but any further weakness opens the 107.80 key low.

Gold
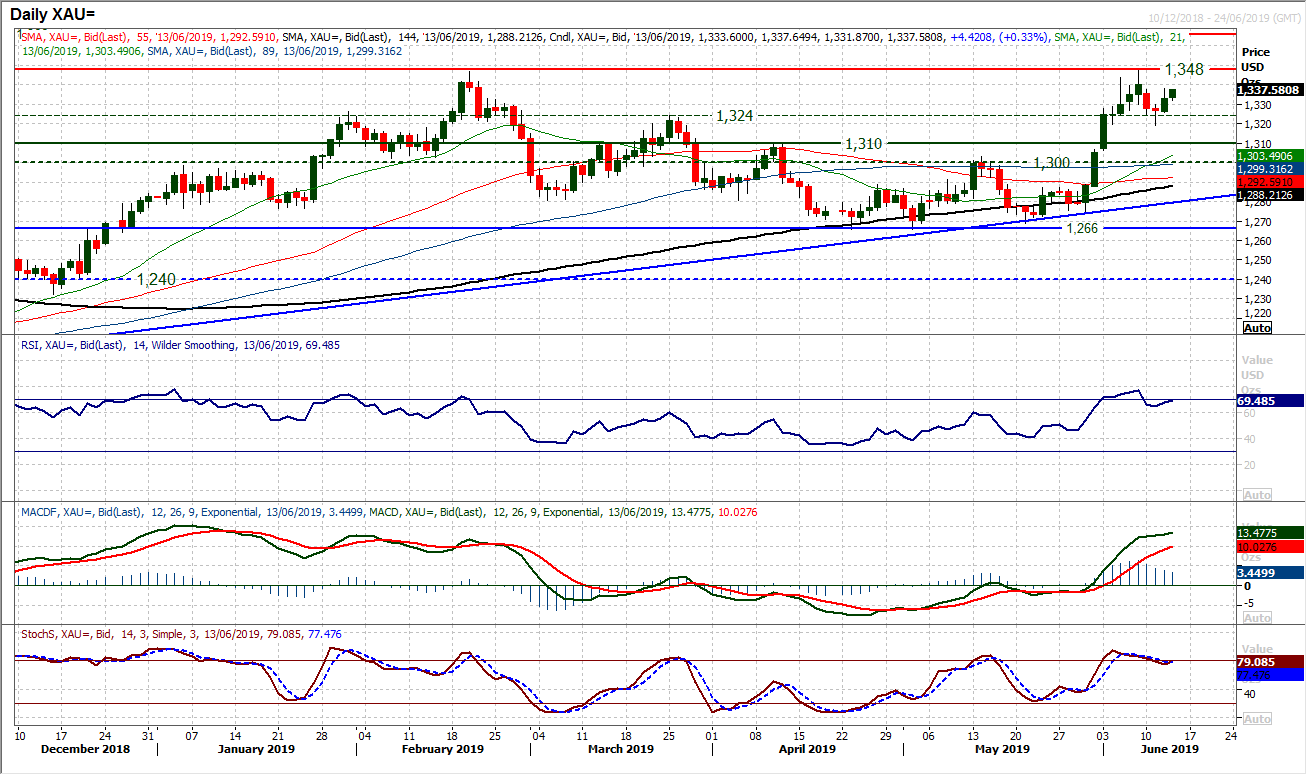
The bulls have reacted strongly to the recent slip, with yesterday’s bull candle maintaining support in a band $1319/$1324. Importantly, the RSI has held above 60 whilst the MACD and Stochastics have restricted their corrective slips. This shows that momentum of any correction is being limited and the support is looking to build again. The hourly chart shows a near term pivot at $1330 should continue to be watched as a gauge for the outlook within the recent few sessions with the price between $1319/$1348. With broader negative market sentiment creeping back in, given the positive candle yesterday and further support formed today, there is an upside bias on gold. This will continue whilst $1330 holds. Above $1338 improves the prospects of pressure on $1348 the 2019 high. There is though considerable resistance between $1348/$1375.
WTI Oil
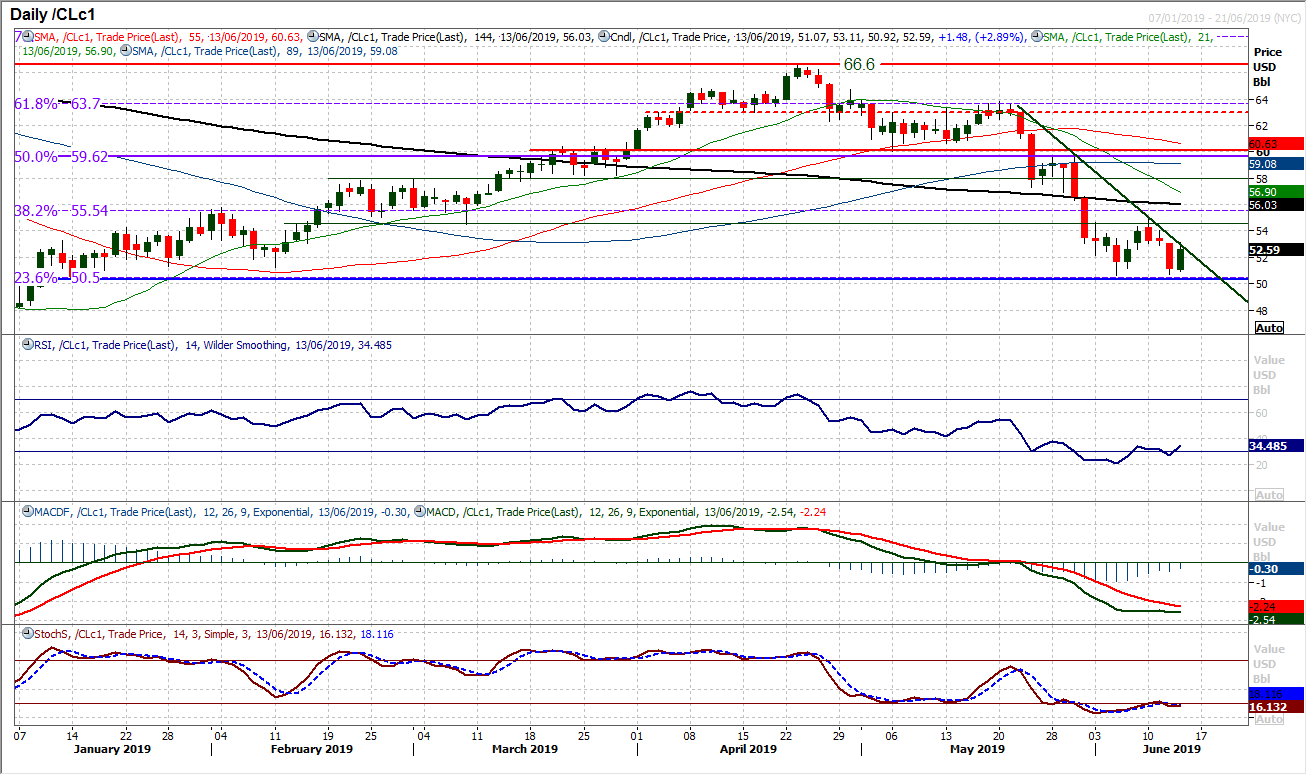
With the rebound rolling over again this week, the market has formed a strong downtrend of the past three weeks. This comes with the continued run of lower highs on RSI and MACD lines, suggesting rallies are a chance to sell. The three successive negative candles have now re-opened the key band of support above $50.00. The 23.6% Fib at $50.50 and June low at $50.60 are once set to more come under scrutiny. Given the negative configuration of momentum indicators, the support just above $50 will now come under significant pressure. This morning we have seen a sharp bounce on oil due to newsflow of an incident with an oil tanker on fire in the Sea of Oman. Once the dust settles, this is likely to be another chance to sell. A closing breach of $50.00 would open levels of early January but the December low at $42.35 is then the next key support. Initial resistance at $52.40.
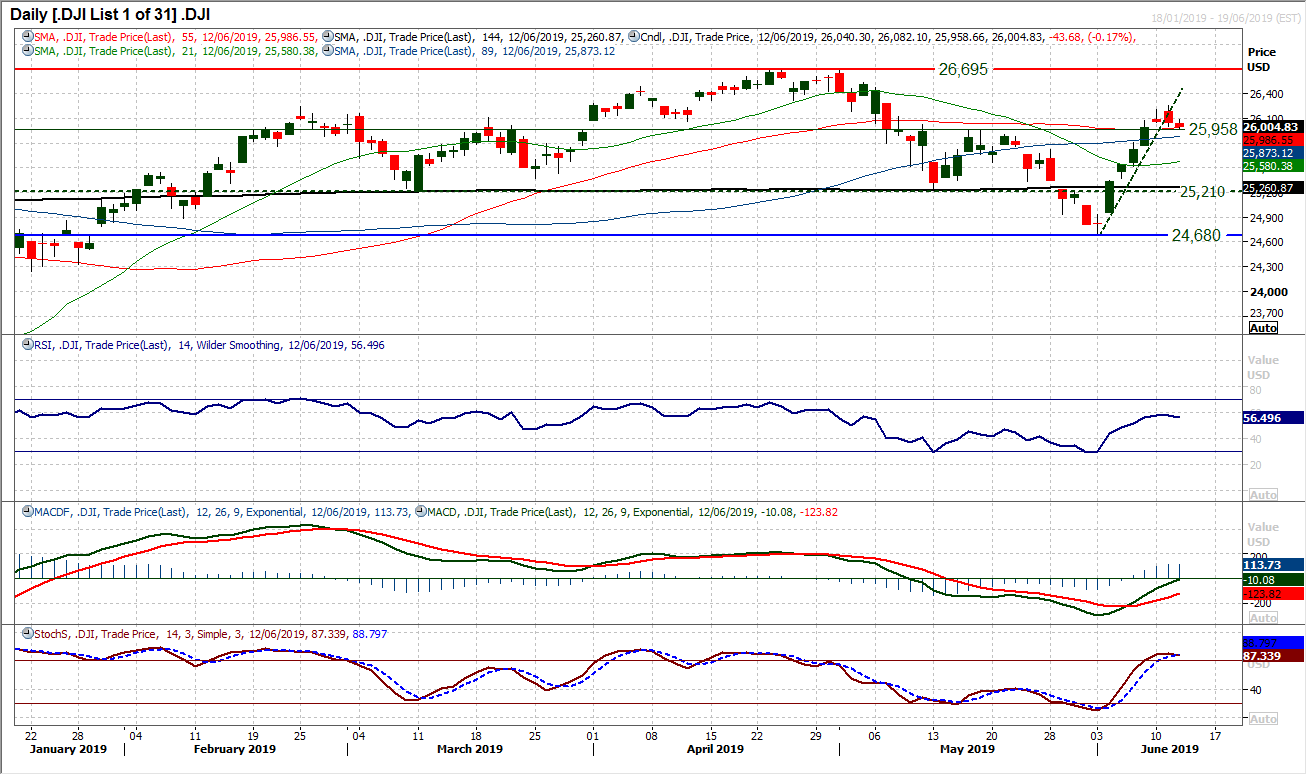
Dow Jones Industrial Average
With risk aversion creeping back into major markets, the Wall Street rally has lost its impetus. The Dow has subsequently broken a sharp one week uptrend with what is now a run of two negative closes, but three negative candles. For now though, the support is holding at the breakout of 25,958. This was the resistance of the mid-May highs and is now a basis of initial support (interestingly holding to the tick in yesterday’s session). However, the market is rolling over just at a point that will be of concern for the medium term outlook. The RSI failing at 60, Stochastics set to bear cross above 80 and the MACD lines losing their way around neutral. Futures are pointing lower early today and the breakout support at 25,958 is likely to come under further pressure. A closing breach with another negative candle would increase the corrective momentum that is now building. Initial support 25,720, with resistance around 26,250 mounting.
Author

Richard Perry
Independent Analyst


