Daily technical and trading outlook – GBP/USD
 DAILY GBP/USD TECHNICAL OUTLOOK

Last Update At 31 Dec 202001:40GMT
Trend Daily Chart
Up
Daily Indicators
Bearish divergences
21 HR EMA
1.3599
55 HR EMA
1.3558
Trend Hourly Chart
Up
Hourly Indicators
Overbought
13 HR RSI
73
14 HR DMI
+ve
Daily Analysis
Resumption of recent uptrend
Resistance
1.3775 - 61.8% proj. of 1.2676-1.3540 fm 1.3135
1.3719 - 2.618 times ext. of 1.3429-1.3523 fm 1.3473
1.3663 - 50% proj. of 1.2676-1.3540 fm 1.3135
Support
1.3673 - Wed's NY low
1.3523 - Tue's high (n ow res)
1.3469 - Tue's European low
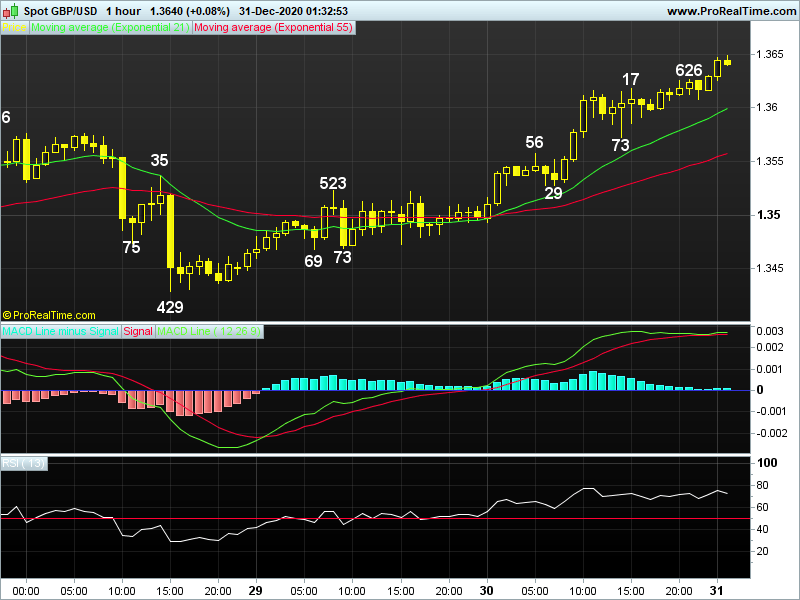
GBP/USD - 1.3641.. Sterling was the strongest G4 currency vs usd y'day, price met renewed buying at 1.3494 (AUS) n climbed steadily to 1.3615 in Europe , despite a brief pullback to 1.3573 in NY, cable hit 1.3626 at the close.
On the bigger picture, despite cable's brief break of 2016 post-Brexit low of 1.1491 to a near 35-year trough of 1.1412 in mid-Mar on safe-haven usd's demand following free fall in global stocks, sterling's rally to as high as 1.28 12 (Jun) on broad-based usd's weakness, then to an 8-month peak of 1.3482 on the 1st day in Sep suggests a major bottom is in place. Although cable has retreated to 1.3189 last Mon after rally abv 2019 high at 1.3516 to a fresh 2-1/2 year peak at 1.3625, Thu's rebound to 1.3620 as a Brexit deal was reached signals pullback has ended n abv 1.3625 would extend to 1.3680/90. On the downside, only a daily close below 1.3305 would risk weakness back to 1.3189, break, 1.3135.
Today, Wed's marginal break of prev. Dec's 2-1/2 year 1.3625 top to 1.36 26, then intra-day firm break confirms recent uptrend has once again resumed n gain to 1.3680/90 is envisaged, o/bot readings on hourly oscillators may cap price at 1.3715/20. Only below 1.3573 signals temp. top n risk 1.3523/28.
Author

AceTrader Team
AceTrader
Led by world-renowned technical analyst Wilson Leung, we have a team of 7 analysts monitoring the market and updating our recommendations and commentaries 24 hours a day.


