Daily technical and trading outlook – EUR/USD
 DAILY EUR/USD TECHNICAL OUTLOOK

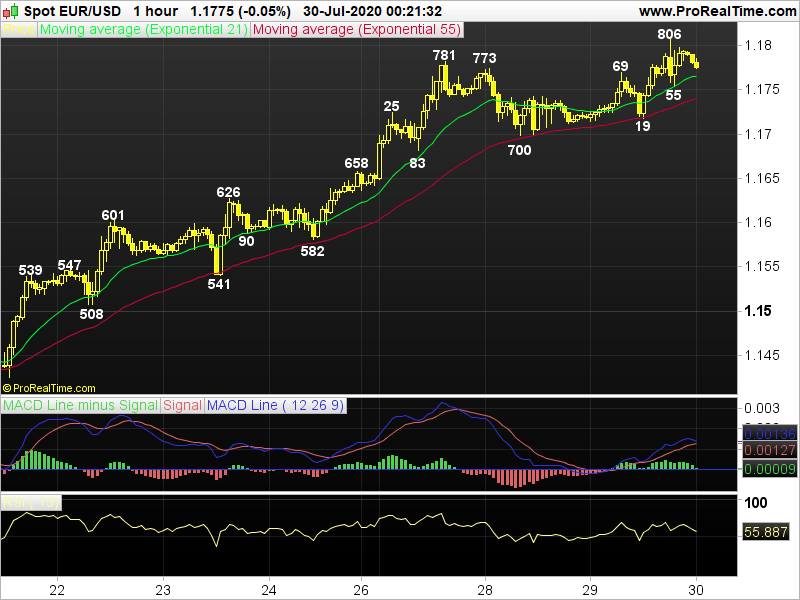
Trend Daily Chart
Up
Daily Indicators
Rising
21 HR EMA
1.1766
55 HR EMA
1.1741
Trend Hourly Chart
Sideways
Hourly Indicators
Bearish divergences
13 HR RSI
58
14 HR DMI
+ve
Daily Analysis
One more rise b4 down
Resistance
1.1861 - 80.9% proj. of 1.1582-1.1781 fm 1.1700
1.1815 - 2018 Sep high
1.1806 - Y'day's fresh 22-month peak
Support
1.1755 - Y'day's hourly sup
1.1719 - Y'day's low
1.1700 - Tue's low
EUR/USD - 1.1778.. Euro met renewed buying y'day at 1.1715 (AUS) n gained to 1.1769 in Europe b4 retreating to 1.1719. The pair then rallied to fresh 22- month peak at 1.1806 on usd's weakness in post-FOMC b4 easing.
On the bigger picture, despite euro's LT upmove fm 2017 near 14-year low of 1.0341 to a fresh 3-year peak of 1.2555 in mid-Feb 2018, price tumbled to a near 3-year 1.0637 low on broad-based usd's strength. Having said that, euro's rally this month due to risk-on trade n then break of Mar's 1.1494 high signals said decline has ended n present rising daily indicators suggest upside bias remains for further headway twd 1.1822 (61.8% r of 1.2555-1.0637), however, minor 'bearish divergences' would prevent strg gain n risk has increased for a correction to take place in late Aug/Sep. On the downside, below 1.1422 anytime signals top is made n may head back twd 1.1000/10.
Today, as euro's break of Mon's 1.1781 top to 1.1806 signals MT uptrend would head twd 1.1820/30 after consolidation, 'bearish divergences' on hourly indicators should cap price below 1.1848 n yield correction. Only daily close below 1.1683 risks stronger retracement to 1.1658 b4 prospect of recovery.
Interested in EUR/USD technicals? Check out the key levels
Author

AceTrader Team
AceTrader
Led by world-renowned technical analyst Wilson Leung, we have a team of 7 analysts monitoring the market and updating our recommendations and commentaries 24 hours a day.


