|

CVR Energy (NYSE:CVI) – Recovery on the Horizon

CVR Energy (NYSE:CVI) lost almost 40% of it’s value since July of last year, as the stock started correcting the impulsive 5 waves advance from 2016 low.

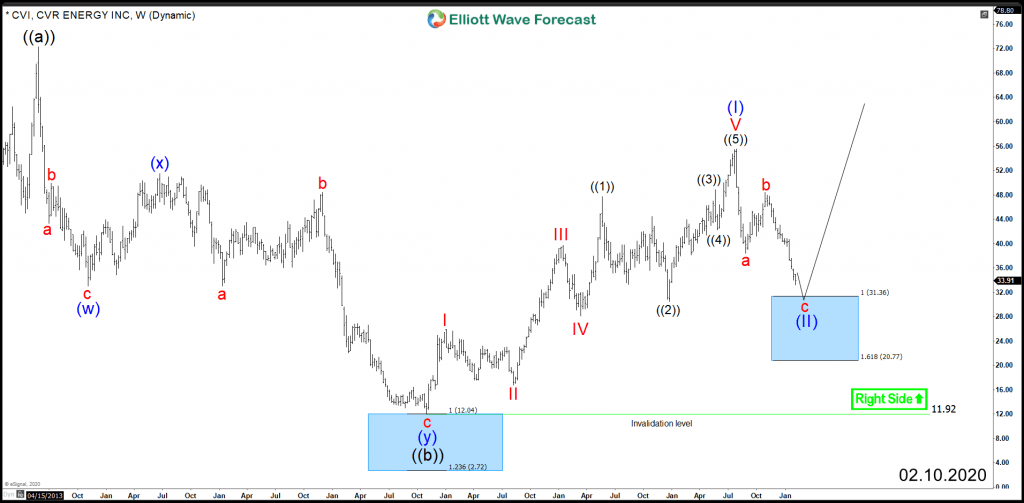
The correction taking place is unfolding as  3 waves Zigzag structure which can ideally find support at equal legs area  $31.36 – $20.77 from where a reaction higher is expected to take place. However if the bounce fail and another leg lower takes place then the move could turns out to be a corrective Flat structure and the decline from 2019 peak is a wave ” c “.

In both scenarios, CVI is expected to end the correction and find support for the coming few months as a bounce is expected to take place in #energy sector based on correlation with related instruments like Chevron , EQT Corporation and Crude Oil .

CVI Weekly Chart

CVI

CVI Flat Scenario

CVI

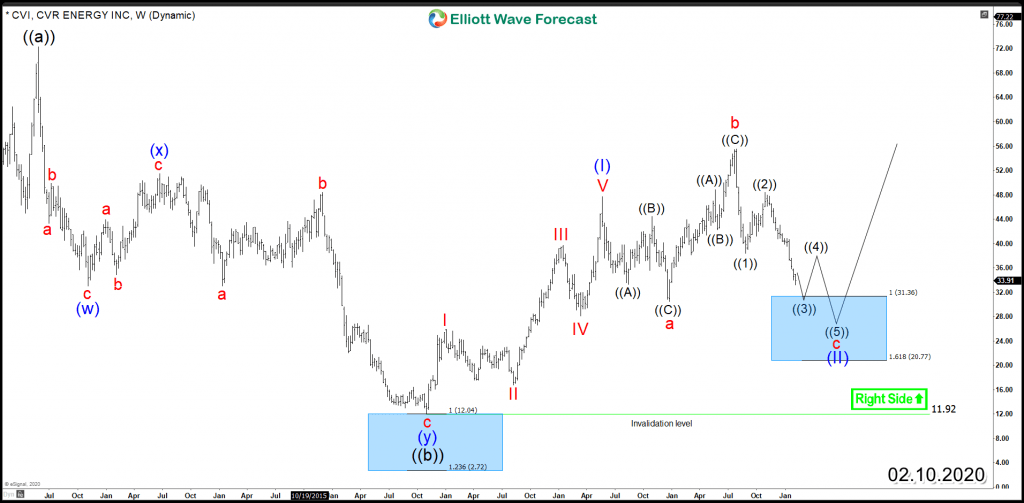
The presented blue box in the above charts is a High-frequency area where the Market is likely to end cycle and make a at least a 3 waves bounce to allow investors to create a risk free position. Consequently, until the stock manage to break above July 2019 peak, it can still do a 7 or 11 swings correction lower before ending wave (II).

Author

Elliott Wave Forecast Team

Elliott Wave Forecast Team

ElliottWave-Forecast.com

More from Elliott Wave Forecast Team
Share:

Editor's Picks

EUR/USD looks sidelined around 1.1850

EUR/USD remains on the back foot, extending its bearish tone and sliding towards the 1.1850 area to print fresh daily lows on Monday. The move lower comes as the US Dollar gathers modest traction, with thin liquidity and subdued volatility amplifying price swings amid the US market holiday.

GBP/USD flirts with daily lows near 1.3630

GBP/USD has quickly given back Friday’s solid gains, turning lower at the start of the week and drifting back towards the 1.3630 area. The focus now shifts squarely to Tuesday’s UK labour market report, which is likely to keep the quid firmly in the spotlight and could set the tone for Cable’s next move.

Gold battle around $5,000 continues

Gold is giving back part of Friday’s sharp rebound, deflating below the key $5,000 mark per troy ounce as the new week gets underway. Modest gains in the US Dollar are keeping the metal in check, while thin trading conditions, due to the Presidents Day holiday in the US, are adding to the choppy and hesitant tone across markets.

Bitcoin consolidates as on-chain data show mixed signals

Bitcoin price has consolidated between $65,700 and $72,000 over the past nine days, with no clear directional bias. US-listed spot ETFs recorded a $359.91 million weekly outflow, marking the fourth consecutive week of withdrawals.

The week ahead: Key inflation readings and why the AI trade could be overdone

It is likely to be a quiet start to the week, with US markets closed on Monday for Presidents Day. European markets are higher across the board and gold is clinging to the $5,000 level after the tamer than expected CPI report in the US reduced haven flows to precious metals.

XRP steadies in narrow range as fund inflows, futures interest rise

Ripple is trading in a narrow range between $1.45 (immediate support) and $1.50 (resistance) at the time of writing on Monday. The remittance token extended its recovery last week, peaking at $1.67 on Sunday from the weekly open at $1.43.