|

Currency market: EUR/USD vs CAD/ZAR

In the January 2020 article, EUR predicts EUR, I revealed how to factor by calculator how all EUR/USD roads lead to EUR/GBP by either EUR/USD reciprocals or as EUR/USD seen by most as 1.2250 for example.

And for interested, from November 2019 to January 2020, located on site  is GBP Predicts GBP, AUD Predicts AUD, NZD predicts NZD, CAD predicts CAD and JPY predicts JPY.

Traders learn how to trade true exchange rates by exchange rates using a calculator. Not only simple and highly profitable but its all mathematically correct. And takes 2 seconds.

EUR/USD perfect opposite currency pair is CAD/ZAR. Peter Wadkins wrote over many years, CAD/ZAR is the true commodity currency. due to the combination and CAD/ZAR derivation as USD/CAD and USD/ZAR.

Find CAD/ZAR price by divide USD/ZAR by USD/CAD. Today CAD/ZAR trading price is 11.36 by USD/ZAR 14.5777 divide USD/CAD 1.2823.

CAD/ZAR big high / Low break is located at 11.86 and EUR/USD 1.1974.

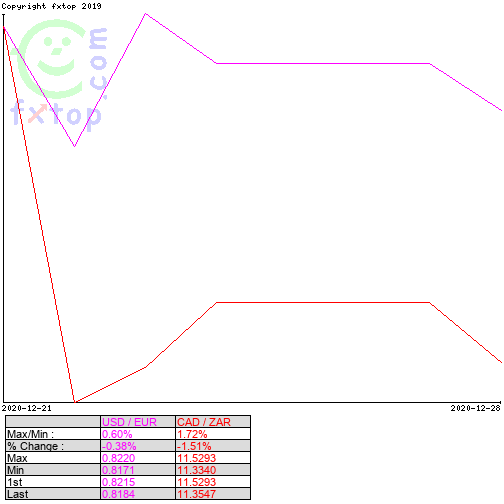
CAD/ZAR as EUR/USD perfect opposite currency is the same as saying CAD/ZAR is the perfect opposite to EUR/USD because CAD/ZAR is actually a USD currency Pair. If EUR/USD is transformed to its reciprocal as USD/EUR then CAD/ZAR and USD/EUR become the same exact same currency pair. See the first chart below.

CAD/ZAR traditionally moves far wider than EUR/USD.

Strategy. If CAD/ZAR breaks above 11.86 then it trades higher and EUR/USD trades lower. Much lower.

Below 1 week USD/EUR Vs CAD/ZAR

Chart

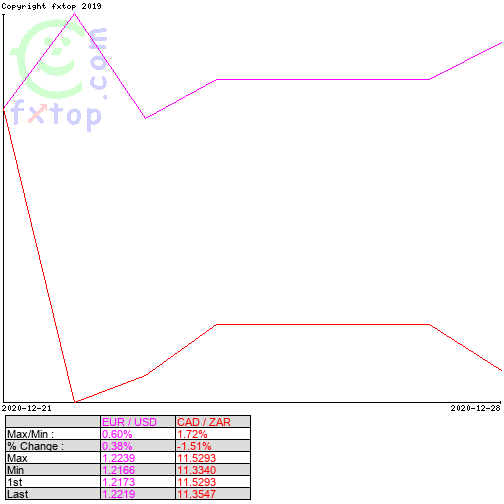
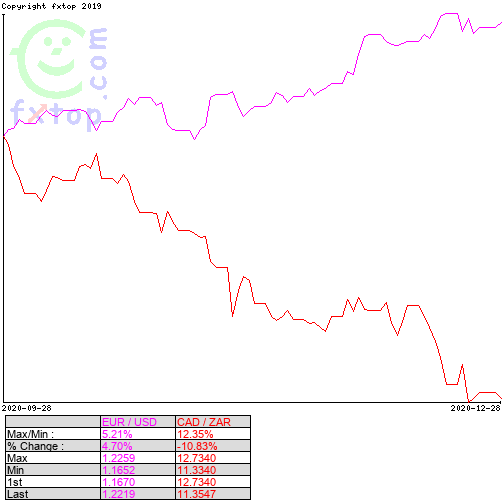
Below 1 week EUR/USD Vs CAD/ZAR. EUR/USD to high and CAD/ZAR to low

Chart

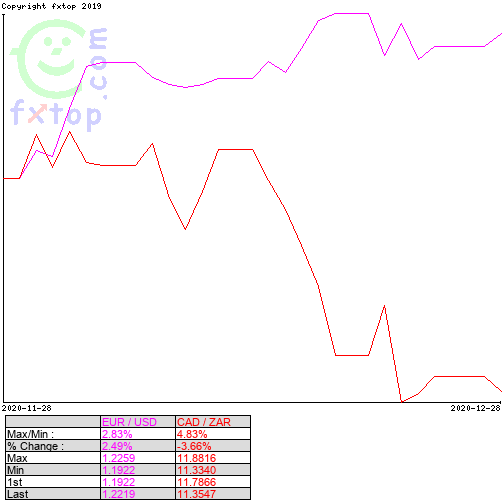
EUR/USD Vs CAD/ZAR 1 month

Chart

EUR/USD Vs CAD/ZAR 3 months

Chart

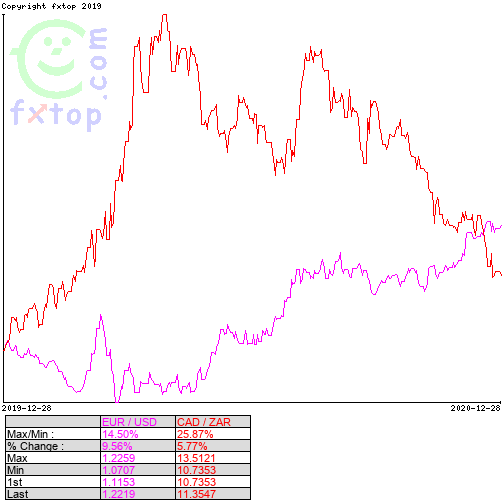
EUR/USD Vs CAD/ZAR 1 Year and the Big Crossover

Chart

EUR/USD Vs CAD/ZAR 2 years
Chart

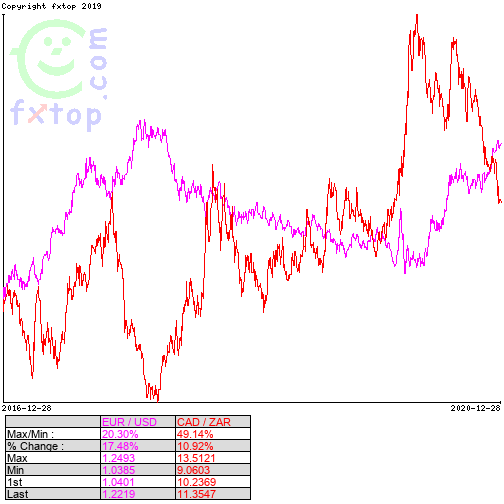
EUR/USD Vs CAD/ZAR 4 Years

Chart

Author

Brian Twomey

Brian Twomey

Brian's Investment

Brian Twomey is an independent trader and a prolific writer on trading, having authored over sixty articles in Technical Analysis of Stocks & Commodities and Investopedia.

More from Brian Twomey
Share:

Editor's Picks

EUR/USD weakens to near 1.1900 as traders eye US data

EUR/USD eases to near 1.1900 in Tuesday's European trading hours, snapping the two-day winning streak. Markets turn cautious, lifting the haven demand for the US Dollar ahead of the release of key US economic data, including Retail Sales and ADP Employment Change 4-week average.

GBP/USD stays in the red below 1.3700 on renewed USD demand

GBP/USD trades on a weaker note below 1.3700 in the European session on Tuesday. The pair faces challenges due to renewed US Dollar demand, UK political risks and rising expectations of a March Bank of England rate cut. The immediate focus is now on the US Retail Sales data. 

Gold sticks to modest losses above $5,000 ahead of US data

Gold sticks to modest intraday losses through the first half of the European session, though it holds comfortably above the $5,000 psychological mark and the daily swing low. The outcome of Japan's snap election on Sunday removes political uncertainty, which along with signs of easing tensions in the Middle East, remains supportive of the upbeat market mood. This turns out to be a key factor exerting downward pressure on the safe-haven precious metal.

Bitcoin Cash trades lower, risks dead-cat bounce amid bearish signals

Bitcoin Cash trades in the red below $522 at the time of writing on Tuesday, after multiple rejections at key resistance. BCH’s derivatives and on-chain indicators point to growing bearish sentiment and raise the risk of a dead-cat bounce toward lower support levels.

Dollar drops and stocks rally: The week of reckoning for US economic data

Following a sizeable move lower in US technology Stocks last week, we have witnessed a meaningful recovery unfold. The USD Index is in a concerning position; the monthly price continues to hold the south channel support.

Bitcoin Cash trades lower, risks dead-cat bounce amid bearish signals

Bitcoin Cash (BCH) trades in the red below $522 at the time of writing on Tuesday, after multiple rejections at key resistance. BCH’s derivatives and on-chain indicators point to growing bearish sentiment and raise the risk of a dead-cat bounce toward lower support levels.