Crude Oil shorts fuel a bull comeback

Crude oil and the entire energy complex have been laggards throughout 2025, while precious metals and base metals have shone brightly. However, after breaking to multi-year lows on rising geopolitical tensions and recession fears, prices have quickly reversed over the last month. And today, this market accelerated to the upside on speculation that Israel is preparing to attack Iran, adding to the uncertainty around nuclear deal negotiations.
From a technical perspective, prices are now attempting to reclaim the decade-long support/resistance level near 63-67 with a downward-sloping moving average directly overhead. RSI indicates that momentum has maintained its bullish range during this downtrend, suggesting that bulls are betting this is a failed breakdown and that more upside is ahead. Bears, on the other hand, see a standard breakdown retest that’s ready to be shorted again.

Sentiment on Stocktwits has shifted into ‘extremely bullish’ territory, suggesting retail is looking for that bull thesis to play out. This short-term battle between bulls and bears at this level will determine the next structural move in crude and the overall energy complex. It’s unlikely to be decided this week or month, but it will remain a key chart to watch through the second half of the year.
Exploring opportunities in the space sector
Growth stocks remain in focus for retail investors, with many names in the ARK Space Exploration & Innovation ETF ($ARKX) the new hunting ground for fresh long opportunities. The ETF recently broke out above its post-IPO highs, ranging from 21.25 to 21.75, with momentum remaining in a bullish range.
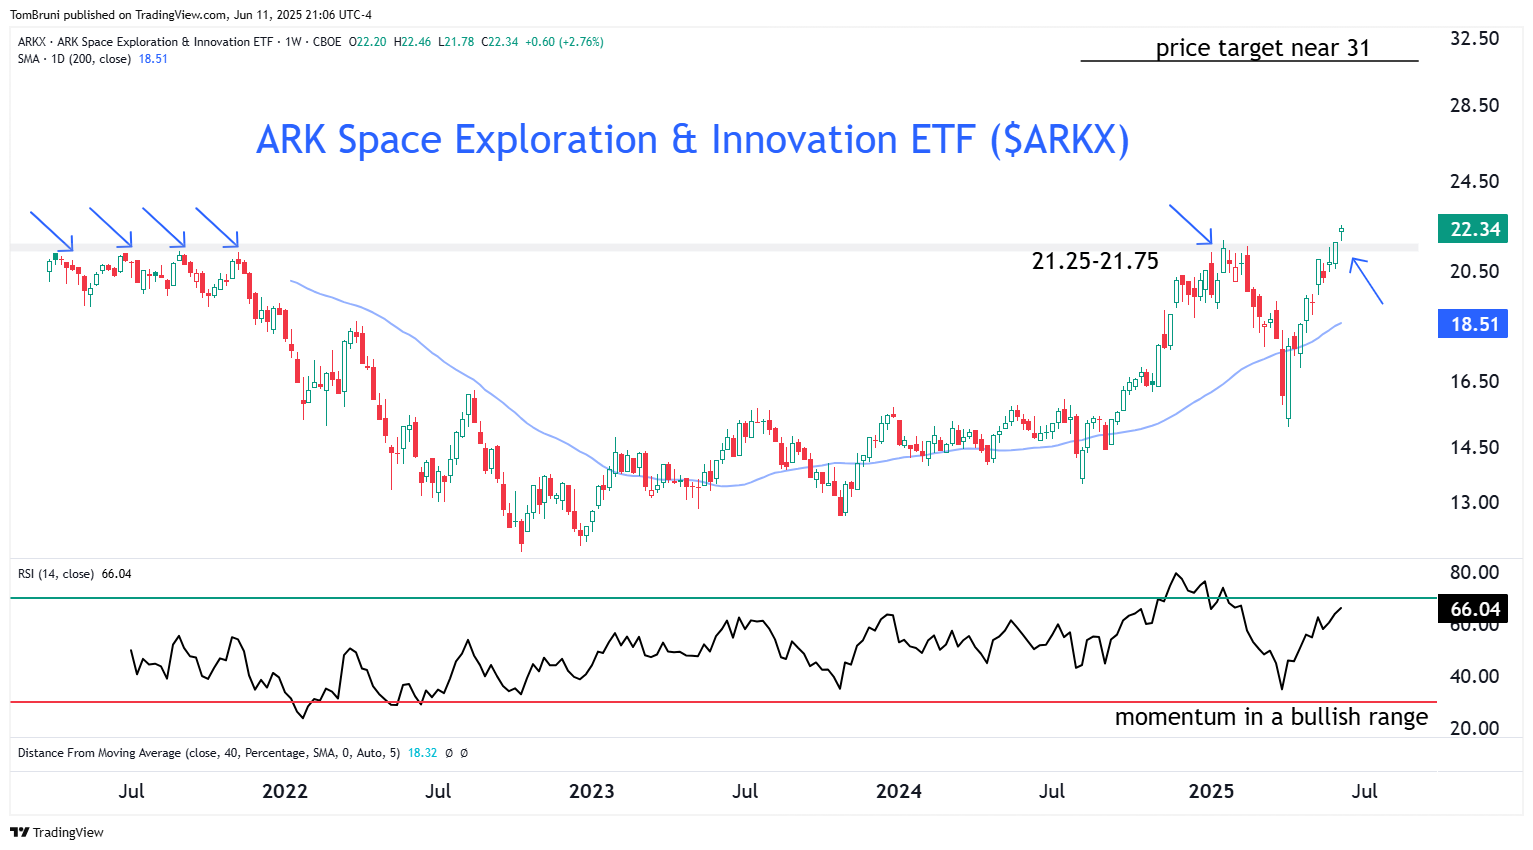
As long as prices are above that area (or roughly 20 if you want to give the breakout more room to breathe), then the long-term upside target is near 31. For those not trading the ETF directly and seeking single-stock exposure, researching its components, such as Kratos Defense & Security Solutions, Iridium Communications, Rocket Lab, Archer Aviation, and others, for potential opportunities.
Retail investors turn on CoreWeave
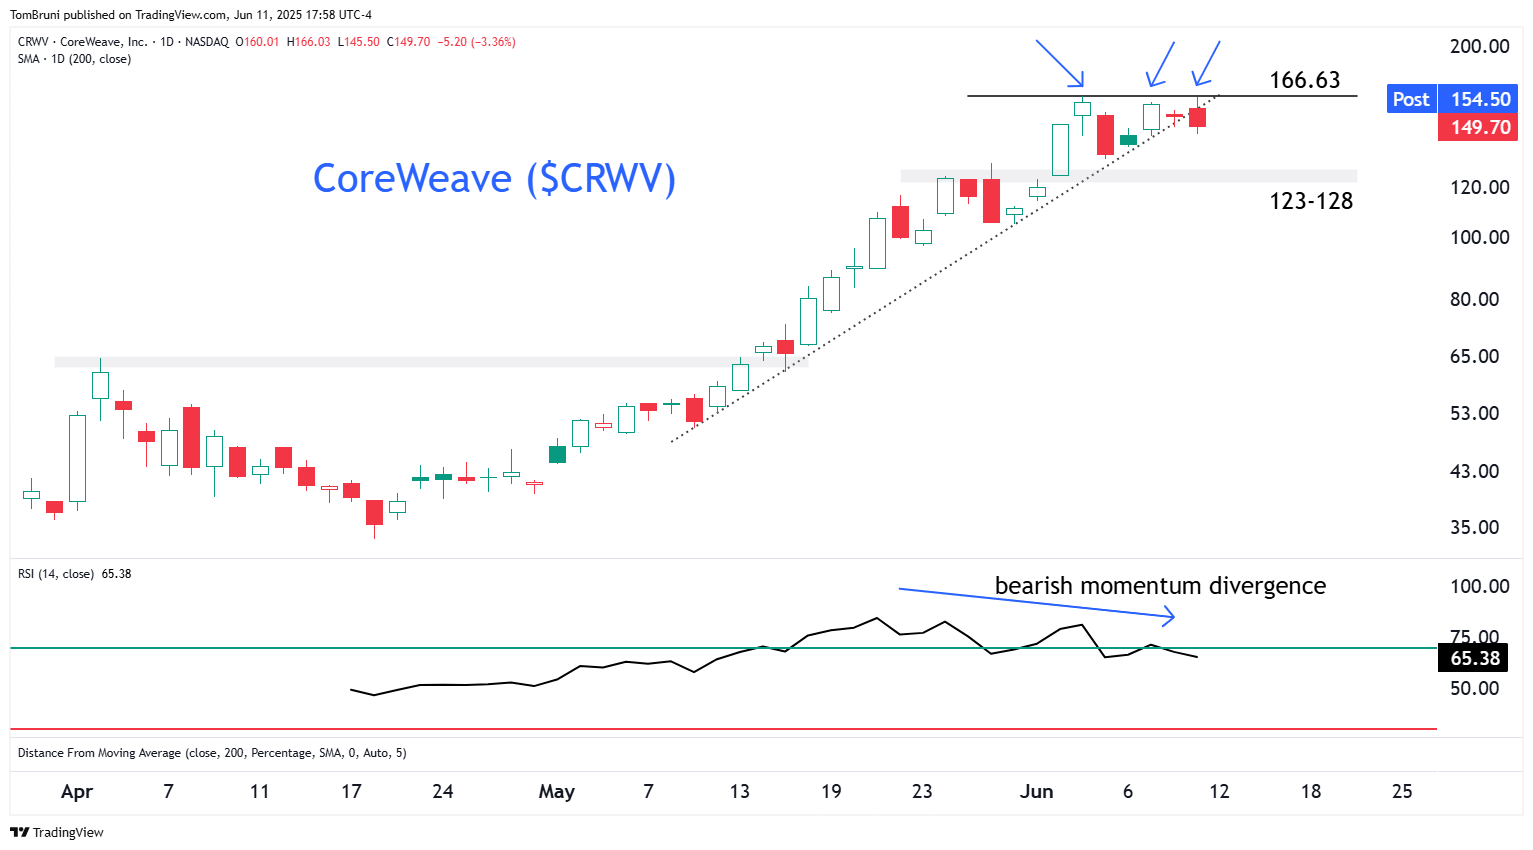
The retail investing community on Stocktwits has begun to turn on hot new issue CoreWeave ($CRWV). Price momentum has stalled, with the stock failing to surpass its initial all-time high of around 167 this week, as momentum diverges negatively. Alongside prices stalling, attention is also beginning to wane as message volumes on Stocktwits taper off and sentiment downshifts into bearish territory.
These are typically signs we see as traders become more cautious on a high-flying name. From both technical and sentiment perspectives, the potential reversal signs are there, and the risk is well-defined on the short side. As long as prices are below 167, we should see some backing and filling toward support near 123-128. From there, we’ll see just how strong the bulls’ conviction around AI plays out, such as with CoreWeave, when the short-term wind is no longer at their back.
Betting certain developed markets could dive
Similar to the counter-trend setup in European Bank shares yesterday, we’re seeing a similar setup in many developed market ETFs outside of the U.S. Let’s review what we’re seeing using Germany ($EWG) as an example.
The country ETF has been up for 9 weeks in a row after breaking out of its multi-decade base. Still, momentum is diverging negatively, indicating that buyers are losing some of their strength, and a potential trend change could be underway.
Additionally, prices are nearly 20% extended from their 200-day moving average, where they’ve historically consolidated or begun correcting. While the structural trend remains strong, those who are long might consider lightening up or not adding to positions here. And for the brave bears taking on the bull market in risk assets, trading this short against the recent highs with a target at the 200-day moving average near 36 is a well-defined opportunity.
For disclosure purposes, I am currently executing this trade using the October 41/36 put spread, with a cost of $1 and a maximum reward of $4.

Thinking outside the box with ouster
One of my favorite features of the Stocktwits platform and community is the trending and active market lists. Seeing where retail investor attention is flowing exposes names that may be underfollowed on Wall Street and in the media. I’m always discovering new stocks, ETFs, and other assets that I’ve never heard of or had forgotten about.
Today’s find is Ouster ($OUST), an American lidar technology company that’s attempting a comeback after losing nearly 98% of its value in the 2021-2022 bear market. However, over the last few years, it has built out a base and is now clearing resistance near 13 to 16 to the upside.
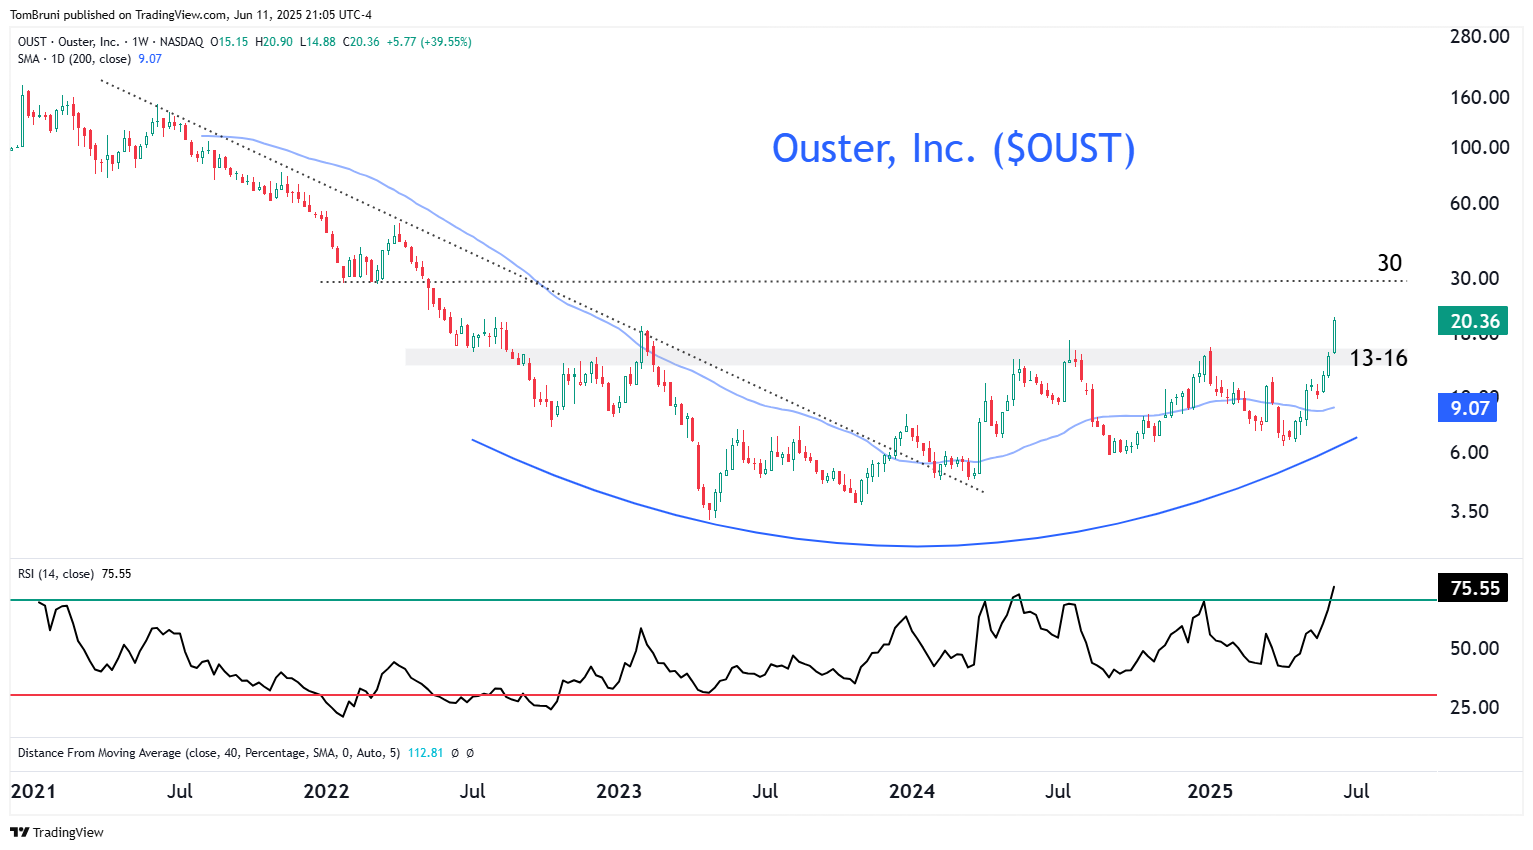
While some may view this short-term move as overextended, the structural trend change here suggests that as long as prices can hold above 13, then buyers will remain in control, and dips will likely be bought. Time will tell, but in a world full of all-time highs, seeing a fresh base breakout in a $1 billion company is one that many bulls are paying attention to…especially if the small-cap summer some analysts are predicting is set to occur.
Unlock exclusive gold and silver trading signals and updates that most investors don’t see. Join our free newsletter now!
Unlock exclusive gold and silver trading signals and updates that most investors don’t see. Join our free newsletter now!
Author

CMT Association Research Team
CMT Association
The CMT Association is a global credentialing body that has served the financial industry for nearly 50 years.


