Crude oil price soars amid a Norwegian port strike


The euro held steady against the dollar as traders wait for the important EU GDP data that will come out at 11:00 GMT. Economists expect data to show that the EU economy contracted by 0.4% in the fourth quarter because of lockdowns in December. On an annualised basis, they expect the data to show that the economy contracted by 5.1%. The Eurostat will also publish the quarterly employment change data.
The price of crude oil continued to rally as traders look forward to the next stimulus deal in the United States. The deal being negotiated will likely total $1.9 trillion. It will allocate funds to households, companies and states. The price is also rising because of an ongoing strike at the Norwegian port that is estimated to disrupt oil exports by a third. This is substantial as Norway pumps about 2.1 million barrels of oil per day.
US futures point to a record open for stocks. Futures tied to the Dow Jones and S&P 500 are up by more than 240 and 25 points, respectively. In Europe, futures linked to the DAX and FTSE 100 are also rising. This performance is mostly because of the rising hopes that Democrats will pass a new stimulus package by the end of the month. They are also rising ahead of key corporate earnings. Some of the companies that will publish their earnings are CVS, Zoetis, Ecolab, Palantir, and TransUnion, among others.
EUR/USD
The EUR/USD rose to an intraday high of 1.2195 mostly because of the weak US dollar. On the four-hour chart, the price is slightly below last week's high of 1.2150. It has also moved above the 21-day and 14-day exponential moving averages (EMA) while oscillators like the Relative Strength Index (RSI) are also rising. Therefore, the pair seems to be on the cusp of a bullish break-out to 1.2200.

GBP/USD
The relentless rally of the British pound continued during the Asian session. The pair rose to an intraday high of 1.3947, its highest point in 34 weeks. On the four-hour chart, the price is above all moving averages and is on the upper side of the Bollinger Bands. The momentum oscillator has also continued to rise. Therefore, the pair will likely continue rising as bulls eye the next resistance at 1.400.

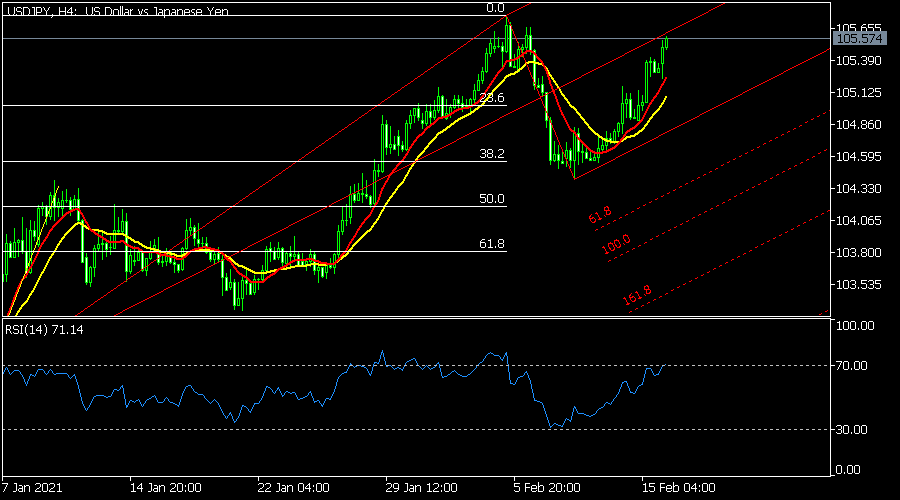
USD/JPY
The USD/JPY pair rose to an intraday high of 105.57 during the Asian session. This price is slightly below the year-to-date high of 105.77. The pair seems to be forming a small cup and handle pattern and is slightly above the short and long term moving averages. It is also above the Ichimoku cloud. Therefore, the pair will likely continue rising as bulls target the next resistance at 105.77.
Author
OctaFx Analyst Team
OctaFX
OctaFX is a market-leading forex broker, providing personalised forex brokerage services to customers in over 100 countries worldwide.