Crude oil analysis points to bullish turnaround

Crude oil experienced a significant drop in price over the past two weeks. This week, however, it appears the energy commodity is bouncing back to the bullish side.
The fall in the price of oil since May was triggered by the fear of a recession, in the US in particular, and numerous central banks’ moving against inflation with rate hikes, leading to slowing economic growth.
This, however, has been mitigated by the fact that the global economy is now facing a lack of supply on the energy front. As global demand closes in on pre-pandemic levels there are indications of further support in demand for fuel.
Supply concerns have cropped up as a result of Saudi Arabia and the UAE running at near oil production capacity and the political unrest occurring in both Ecuador and Libya. Given that these countries are some of the few that could fill the void left by the Russian sanctions, any hint of disruption may play a role in supporting or surging oil prices.
On the other hand, US President Joe Biden last week called on Congress to suspend the Federal gasoline tax for 3 months. President Biden, in calling for gas tax holiday, further stated he wants merchants to pass on the entire reduction to consumers and the industry to refine more crude oil into gasoline to increase supply.
On the technical side of Crude oil, after the conclusion of the OPEC meeting, we might see an increase in volatility in oil prices.
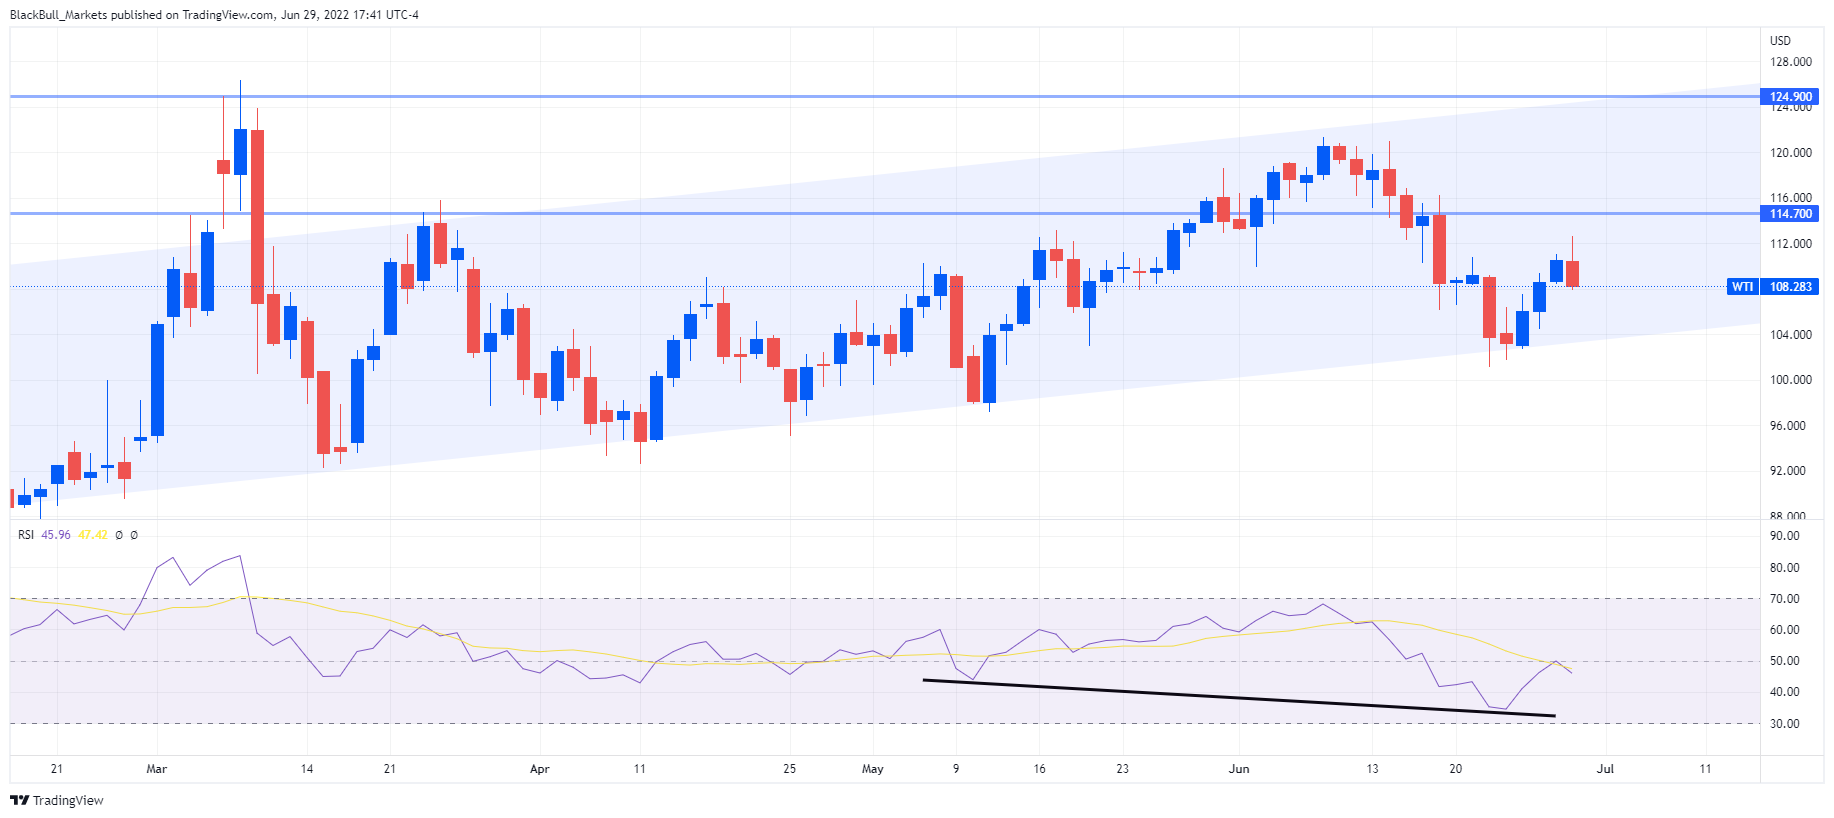
WTI Crude oil, 1D, with RSI indicator
On the daily chart, we can see a clear uptrend as the price bounces around its trend channel. Price made a rebound at around 104.0 on the lower trendline creating a bullish structure. As the price heads towards a minor resistance of 114.70, a break above this area could potentially send price towards 120.20 and possibly retest 124.9 before bouncing back around the upper channel for a possible price correction respecting the current trend indicator.
One could also notice a bullish hidden divergence on the RSI as it creates a lower low while the candle stick chart creates a higher low on the daily time frame signaling for a potential turn to the upside. Any shift in fundamental factors, however, might negate this bullish indicator.
Author

Mark O’Donnell
Blackbull Markets Limited
Mark O’Donnell is a Research Analyst with BlackBull Markets in Auckland, New Zealand.


