CPI doesn't sink markets

USD: Dec '24 is Up at 106.740.
Energies: Dec '24 Crude is Up at 68.69.
Financials: The Dec '24 30 Year T-Bond is Up 7 ticks and trading at 116.02.
Indices: The Dec '24 S&P 500 emini ES contract is 26 ticks Higher and trading at 6022.50.
Gold: The Dec'24 Gold contract is trading Down at 2559.10.
Initial conclusion
This is not a correlated market. The USD is Up and Crude is Up which is not normal, and the 30 Year T-Bond is trading Higher. The Financials should always correlate with the US dollar such that if the dollar is Higher, then the bonds should follow and vice-versa. The S&P is Higher and Crude is trading Higher which is not correlated. Gold is trading Lower which is correlated with the US dollar trading Up. I tend to believe that Gold has an inverse relationship with the US Dollar as when the US Dollar is down, Gold tends to rise in value and vice-versa. Think of it as a seesaw, when one is up the other should be down. I point this out to you to make you aware that when we don't have a correlated market, it means something is wrong. As traders you need to be aware of this and proceed with your eyes wide open. Asia traded mainly Lower with the exception of the Singapore exchange. All of Europe is trading Higher.
Possible challenges to traders
-
Core PPI m/m is out at 8:30 AM EST. This is Major.
-
PPI m/m is out at 8:30 AM EST. This is Major.
-
Unemployment Claims are out at 8:30 AM EST. This is Major.
-
FOMC Member Barkin Speaks at 9 AM EST. This is Major.
-
Natural Gas Storage is out at 10 AM EST. This is Major.
-
Crude Oil Inventories is out at 11 AM EST. This is Major.
-
ECB President Lagarde Speaks at 2 PM EST. This is Major.
-
Fed Cahir Powell Speaks at 3 PM EST. This is Major.
Traders, please note that we've changed the Bond instrument from the 10 year (ZN) to the 2 year (ZT). They work exactly the same.
We've elected to switch gears a bit and show correlation between the 2-year Treasury notes (ZT) and the S&P futures contract. The YM contract is the Dow Jones Industrial Average, and the purpose is to show reverse correlation between the two instruments. Remember it's likened to a seesaw, when up goes up the other should go down and vice versa.
Yesterday the ZT migrated Higher at around 8:30 AM EST with the CPI numbers reported at that time reported at that time. The Dow dived Lower at the same time. Look at the charts below and you'll see a pattern for both assets. The Dow moved Lower at 8:30 AM and the ZT moved Higher at around the same time. These charts represent the newest version of Bar Charts, and I've changed the timeframe to a 15-minute chart to display better. This represented a Long opportunity on the 2-year note, as a trader you could have netted about 50 ticks per contract on this trade. Each tick is worth $7.625. Please note: the front month for ZT is Dec and the Dow is now Dec '24. I've changed the format to filled Candlesticks (not hollow) such that it may be more apparent and visible.
Charts courtesy of Barcharts
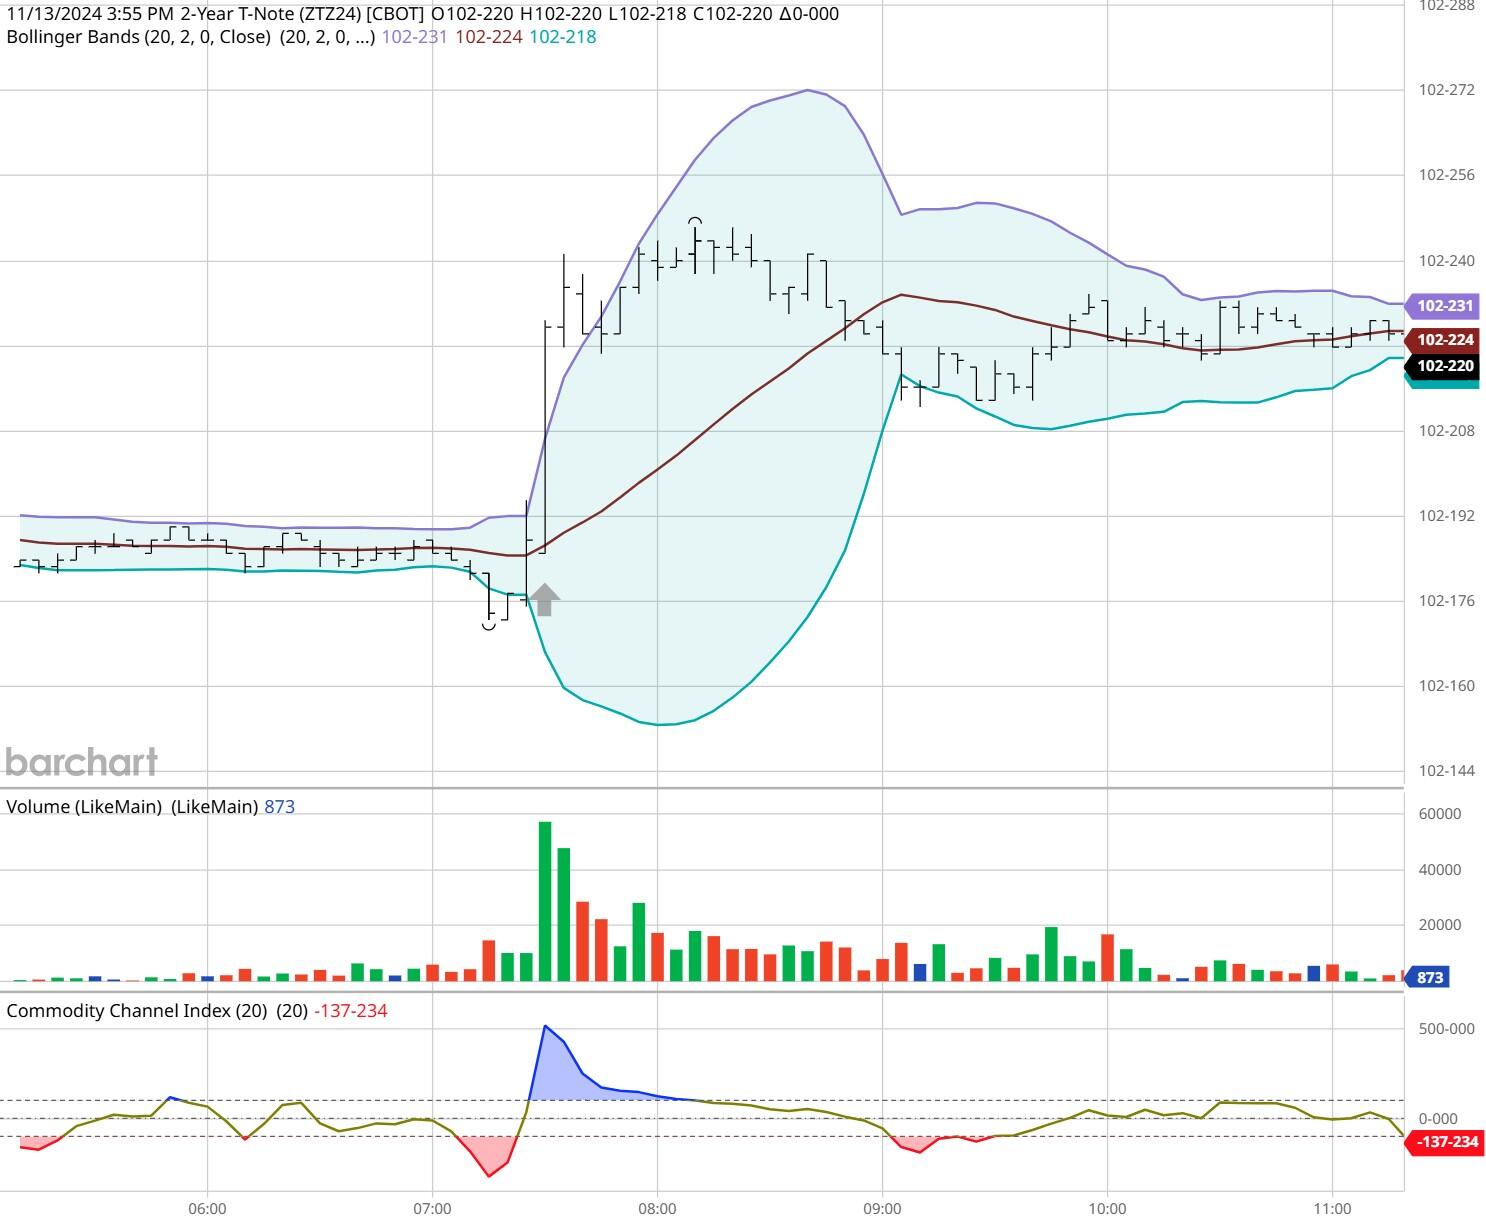
ZT -Dec 2024 - 11/13/24
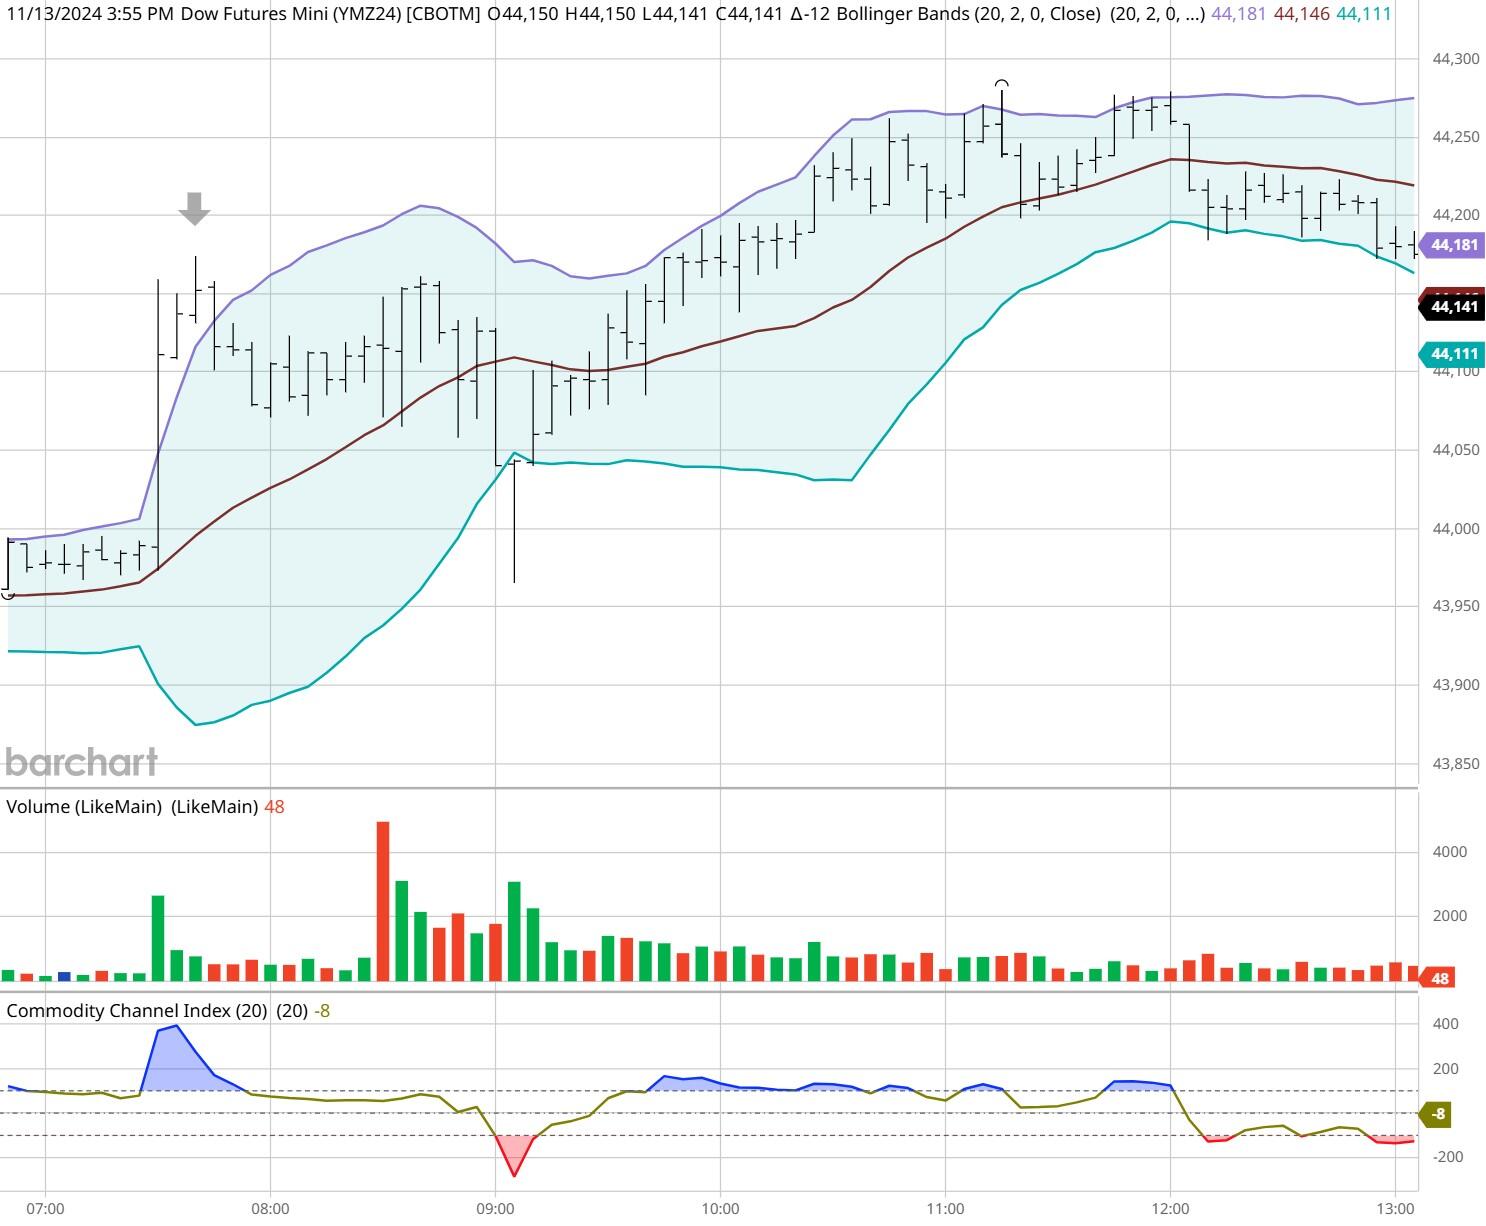
Dow - Dec 2024- 11/13/24
Bias
Yesterday we gave the markets a Downside bias, but the markets had other ideas. The Dow closed Higher by 47 points; the S&P Higher by 1 point but the Nasdaq closed Lower by 50. Today we aren't dealing with a correlated market, and our bias is Neutral or Mixed.
Could this change? Of Course. Remember anything can happen in a volatile market.
Commentary
Well, the CPI numbers were released yesterday, and they did not torpedo the markets as they were in line with expectation. Today we have the PPI numbers, and you should think of them as CPI for producers and suppliers as that will measure the expected gain in price that producers will charge manufacturers for raw materials or components. The lower the number the more likely prices will be reduced and the Federal Reserve monitors both CPI and PPI when it comes to interest rates.
Author

Nick Mastrandrea
Market Tea Leaves
Nick Mastrandrea over 20 years experience in trading and formerly held a NASD Series 7. He currently holds a NJ Life, Health and Variable Authority. Nick is a published writer and his work has appeared in Futures Magazine, TraderPlanet and others.


