Core CPI cools, but Oil keeps 2% target out of reach

Yesterday’s inflation report should have been good news for markets.
Core CPI rose just 0.2% month-on-month, helping ease concerns that underlying inflation was accelerating again. Annual core inflation also edged down to 2.9%, supporting the view that price pressures are gradually moderating.
Under normal circumstances, that would have been enough to fuel a relief rally.
Instead, the market response was far less convincing:
- Nasdaq closed -2.14% from the previous day.
- S&P 500 declined by -1.63%.
- Gold closed -4.41% lower.
- USOIL bumped higher by +3.53%.
- UKOIL closed +2.88% higher.
- DXY climbed by +0.09% after an initial fall of -0.30%.
At the same time, US crude inventories posted another significant draw of -7.2M, keeping the tight oil supply story firmly in focus.
The market now finds itself confronting a familiar problem. Underlying inflation is cooling but energy markets continue to threaten the final stretch of the Fed’s inflation fight.
Inflation relief arrives, but not everywhere
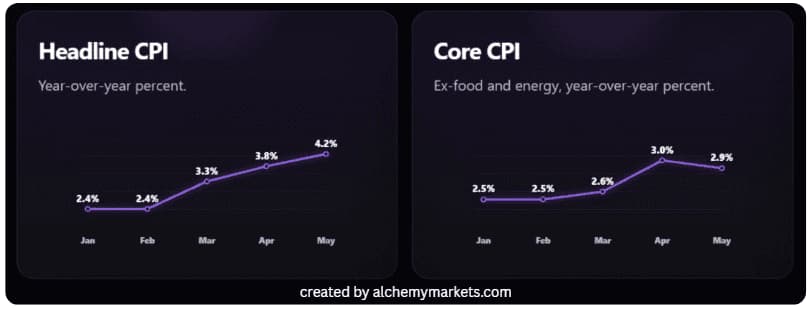
Headline CPI rose to 4.2% year-on-year, continuing the gradual climb seen since February. However, core CPI remained much more contained at 2.9%, while monthly core inflation came in at just 0.2%.
This distinction matters because markets tend to focus on core inflation when assessing the likely path of Federal Reserve policy.
The good news is that core inflation is not accelerating.
The less encouraging news is that headline inflation continues to rise, largely due to energy-related pressures, making it difficult for the Federal Reserve to cut interest rates.
PPI data surprises to the downside
Today’s PPI report added another layer to the disinflation story. Producer prices slowed from April, suggesting that upstream price pressures are no longer accelerating as aggressively. That supports the view that inflation pressure is easing beneath the surface.
Taken together, softer core CPI and slower PPI should have helped markets price a cleaner path toward eventual Fed cuts.
The NY open today will be an interesting tell to see where the market’s head is at.
Producer prices may be cooling now, but if energy costs remain elevated, they can still feed into transport, manufacturing, supply chains, and future inflation expectations.
Oil is keeping inflation risks alive
If there is one reason that explains why markets remain cautious, it is the consistently shrinking supply of oil.
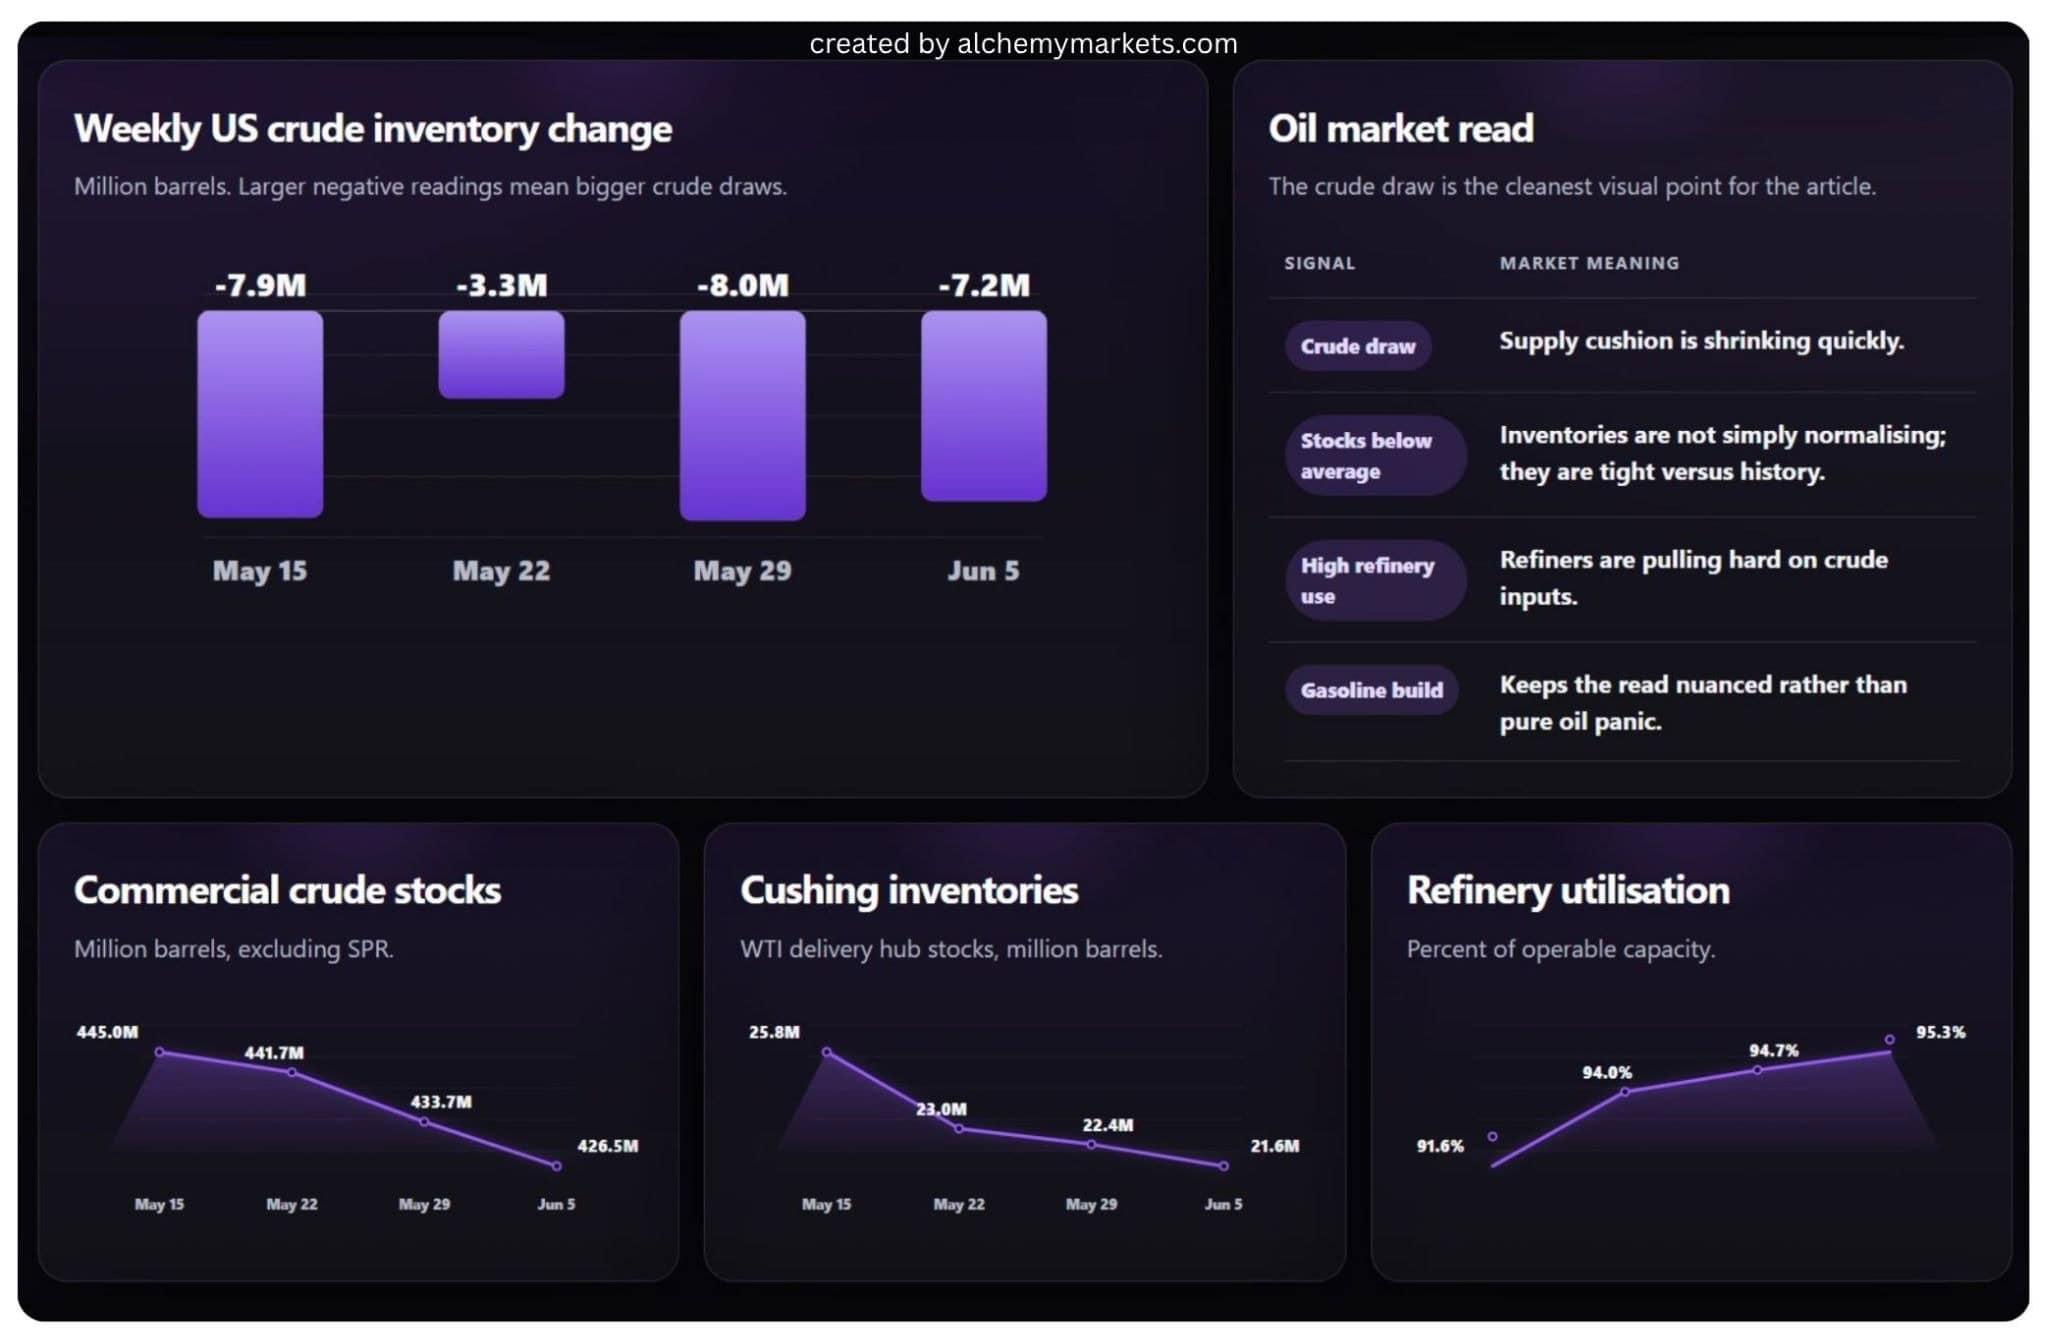
The latest EIA report showed a -7.2 million barrel draw in US crude inventories, following another 8 million barrel draw the previous week. Commercial crude stocks have fallen steadily, while inventories at Cushing continue to decline.
Cushing inventories are now near 21.6 million barrels, which acts as a buffer for disruptions to oil delivery. That is close to 20 million barrels, a level many stock traders regard as where available supply begins to look more constrained for the WTI delivery hub.
At the same time, refinery utilisation climbed to 95.3%, suggesting refiners are still pulling heavily on crude supplies.
Taken together, these data points paint a clear picture: the physical oil market remains relatively tight.
Gasoline inventories did record a modest build, which keeps the read from becoming one-way bullish across every energy product. However, the overall report still supports the idea that crude supply remains tight, especially with refinery demand still elevated.
Nevertheless, the broader trend remains supportive for oil prices.
This is why oil matters so much for the Fed — physical oil is undeniably tightening, and when it unwinds, it can disrupt the easing inflation readings. The market may be pricing in the Fed’s reluctance to cut rates based on this new batch of data.
USOIL remains supported despite pullback
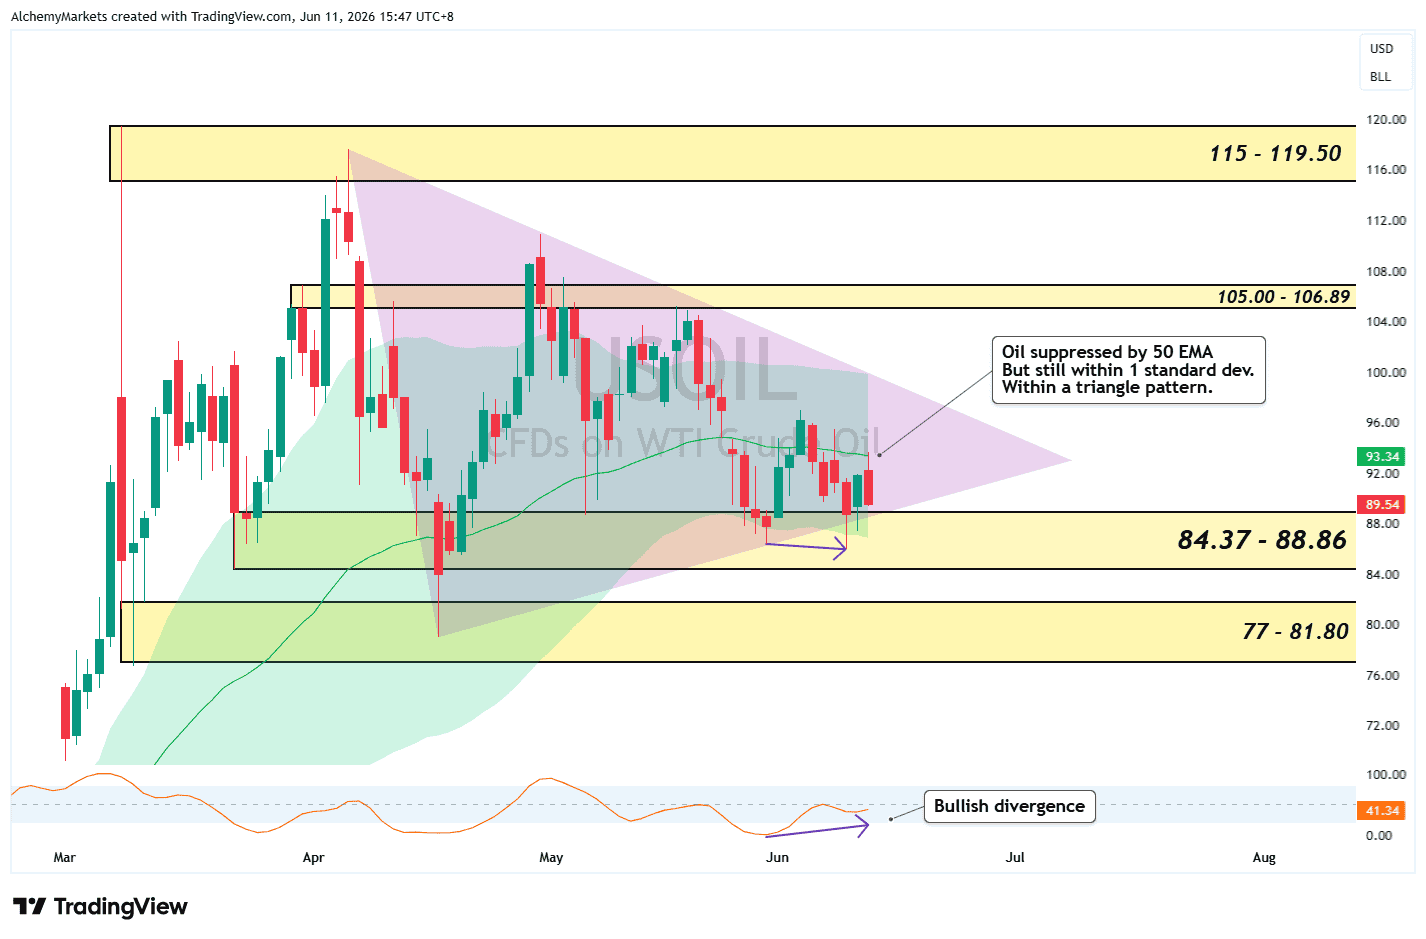
Despite pulling back during Thursday’s session, WTI crude remains above a major support zone between $84.37 and $88.86.
Price continues to trade within a broader consolidation pattern, while the daily 50 EMA remains overhead resistance. The recent decline may appear counterintuitive given the bullish inventory data, but traders appear to be fading some of the geopolitical premium rather than aggressively pricing new supply disruptions.
Importantly, the pullback has not invalidated the broader structure.
Crude remains within its longer-term range, inventories continue to tighten, and refinery demand remains strong. The chart also highlights a developing bullish divergence in momentum, suggesting downside pressure may be slowing even as prices consolidate.
For now, oil’s technical picture remains neutral-to-supportive rather than outright bearish.
Higher energy prices can eventually feed into transportation costs, production expenses, consumer expectations, and future inflation readings.
CPI may have delivered relief. The physical oil market continues to suggest that inflation risks have not disappeared.
Dollar and yields refuse to confirm the relief trade
If markets were fully embracing the disinflation narrative, we would typically expect the dollar and bond yields to move lower.
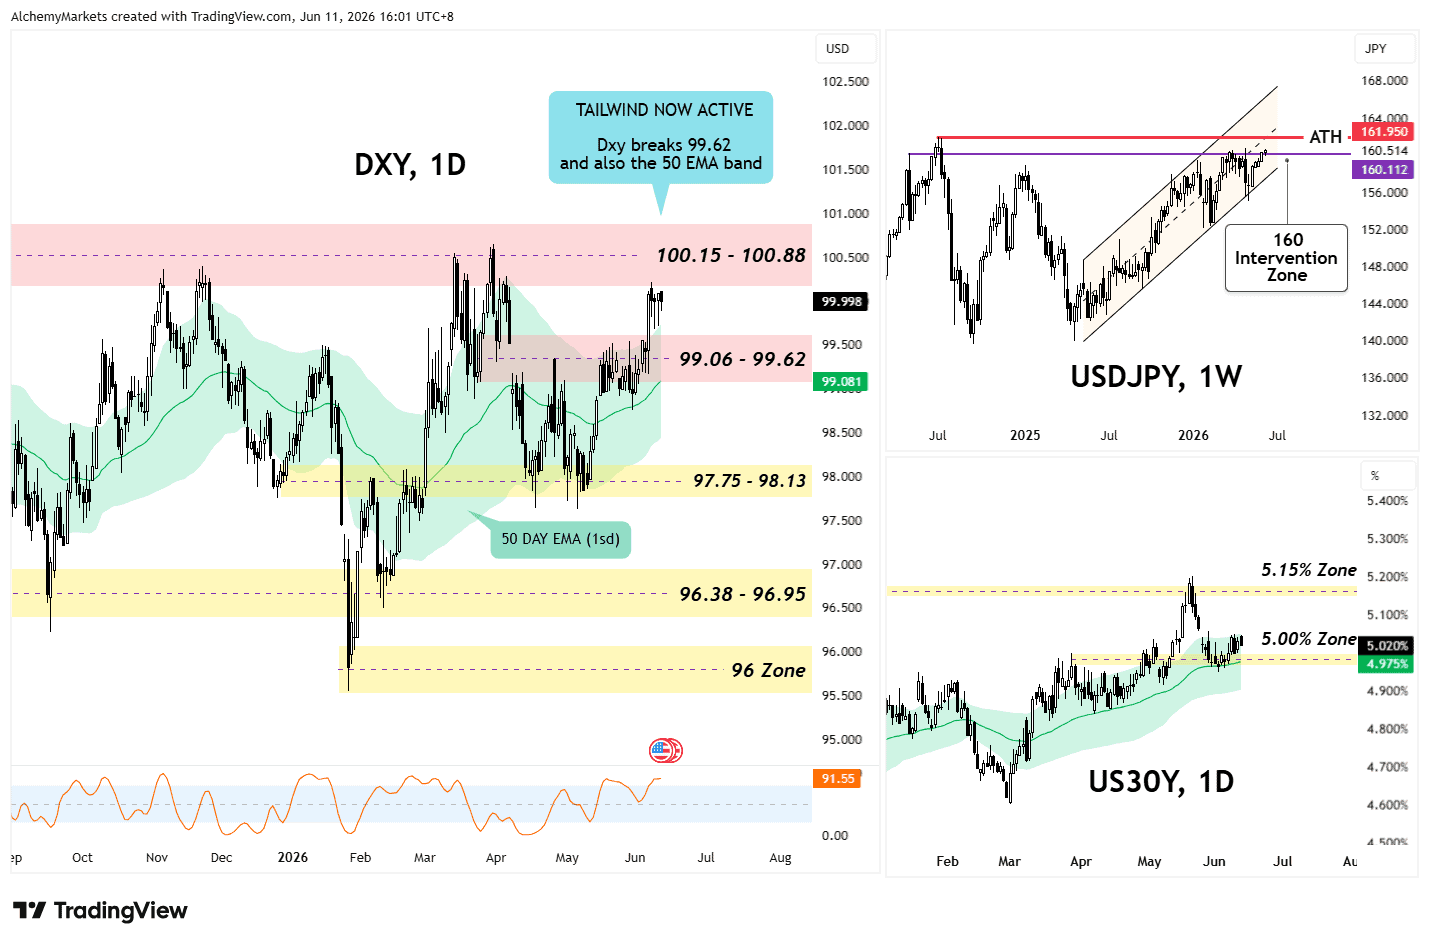
ut, as of the last few days, the US 30-Year Bond Yields has been grinding higher after a retest of the 50-day EMA, and the psychologically important 5.00% zone.
The US Dollar Index (DXY) has reclaimed its daily 50 EMA band (set to 1 standard deviation), and is now approaching the 100.15-100.88 resistance zone.
At the same time, USDJPY remains close to the 160 intervention zone, creating growing tension between US monetary policy and potential Japanese intervention.
These markets often provide confirmation for broader macro trends.
For now, they continue to support the higher-for-longer narrative rather than an aggressive Fed-cut narrative.
Equities struggle at key support
The S&P 500 has also struggled to fully embrace the relief narrative.
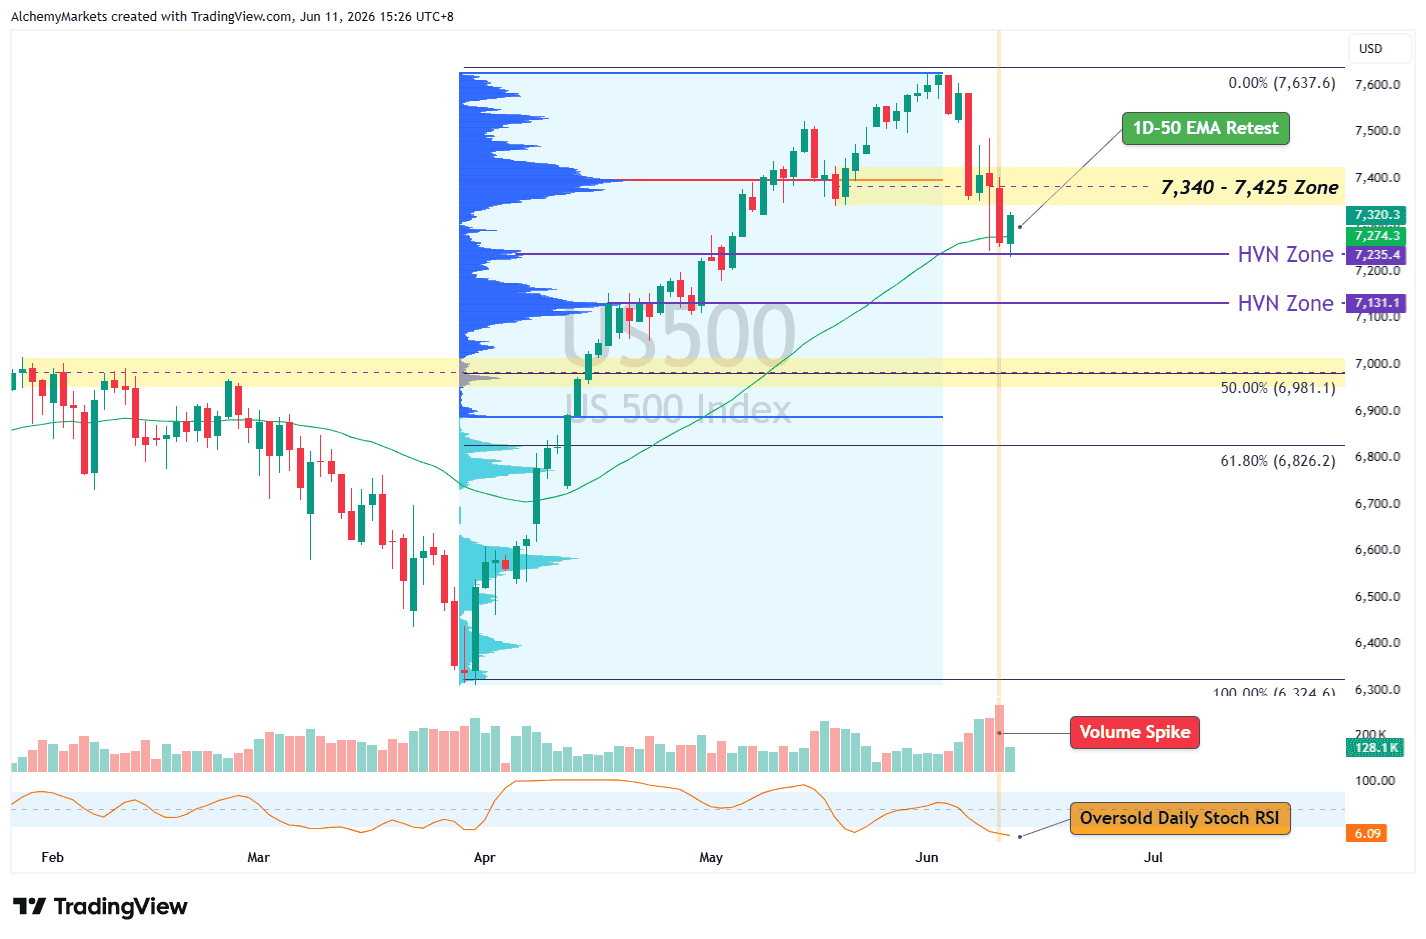
On the US500 CFD chart, the S&P is currently retesting its daily 50 EMA near 7,274 and the high-volume node around 7,235, as measured by the volume profile (VP) from the swing low at ~6,300 to ~7,600.
This shows some demand in the CFD and futures markets for the S&P, but there is no clear test and bounce on the actual SPX index yet.
What is shared between the two charts though, is that the $7,340 to $7,425 zone has now firmly flipped into resistance. This aligns nicely with the VP’s point of control, which is the price with the highest traded volume of this 9 week rally.
A break lower beyond the 50 EMA could expose the next support area near 7,131, while a deeper retracement could bring the psychologically important 7,000 level into focus.
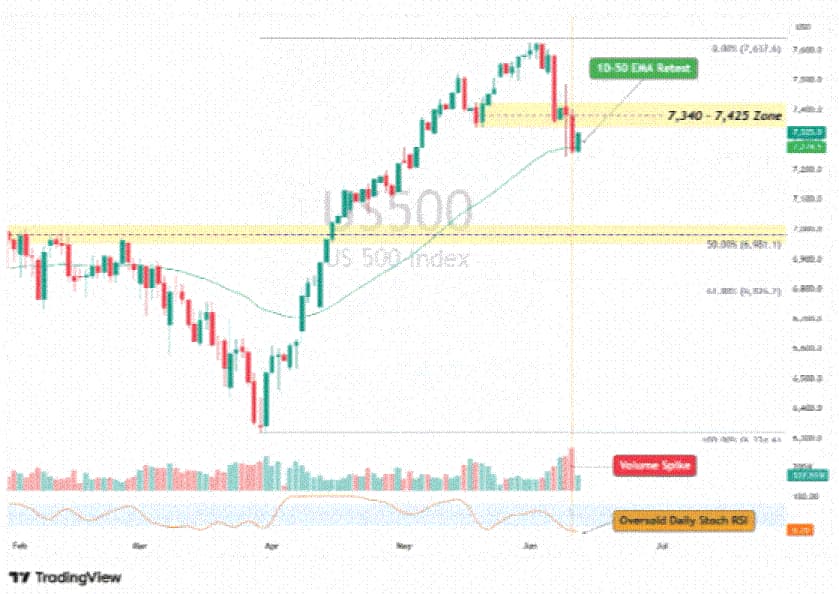
On the stochastic RSI, the S&P has become oversold, increasing the potential for short-term rebounds.
However, price action suggests investors remain hesitant to fully embrace the idea that inflation risks have disappeared.
If inflation concerns were truly behind us, the reaction would likely have been far stronger.
Macro crossroads overview
Bull case | Bear case |
Core CPI cooled | Oil inventories tightening |
PPI slowed from April | Cushing stocks near fragile levels |
Inflation shock avoided | DXY breaking higher |
SPX support holding | US30Y near 5% |
Services inflation easing | Energy inflation risk remains |
Markets received the softer inflation data they were hoping for.
Core CPI cooled, and PPI slowed from April’s spike.
What markets did not receive was confirmation that the Fed’s inflation fight is finished.
Oil remains tight, the dollar is strengthening, and bond yields continue to suggest the Federal Reserve may have less room to ease than investors would like.
Inflation is moving closer to the Fed’s target, but the final stage may prove the most difficult.
With oil inventories tightening and energy markets remaining sensitive to geopolitical developments, traders are increasingly focused on whether oil becomes the last obstacle standing between inflation and 2%.
Author

Zorrays Junaid
Alchemy Markets
Zorrays Junaid has extensive combined experience in the financial markets as a portfolio manager and trading coach. More recently, he is an Analyst with Alchemy Markets, and has contributed to DailyFX and Elliott Wave Forecast in the past.


