Commodities Weekly: Gold gives back most of 2019 gains

A lack of cumulative positive news on the US-China trade front has given the US dollar a leg higher to the detriment of most commodities. The weak headline US payrolls data also questioned the global growth path.
Precious metals
GOLD retreated to the lowest since January 25 last week, touching below its opening level for 2019. The US dollar drivers overcame gold’s safe-haven demand even after the Fed’s Powell said US rates would be on hold until a clearer picture emerges of how global conditions are evolving. In other words, there is no time restraint to the Fed’s current “on-hold” stance.
Speculative bulls pared back their net long positions to the lowest since the week of January 22, according to the latest data from CFTC as at March 5. Official data out of China also confirmed that China added gold to its reserves in February, the third month in a row, but this failed to offer gold much support. Gold fell 0.63% versus the US dollar last month.
Gold Daily Chart
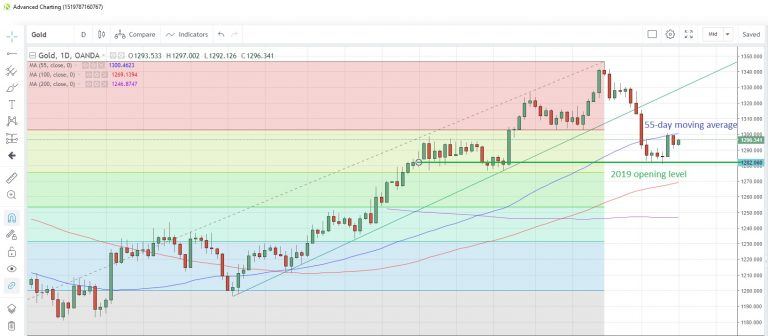
Source: OANDA fxTrade
SILVER is consolidating Friday’s strong rebound, the biggest daily gain in six weeks, after testing support at the 100-day moving average. Last Friday, exchange-traded funds cut 1.31 million troy ounces from their holdings, the biggest one-day fall since February 7, Bloomberg reported. Speculative investors also turned less bullish by reducing their net long positions by the most since December 2017. They are now at the lowest since the week of December 25.
The gold/silver (Mint) ratio looks set for its third down-day in a row after touching the highest since December 26 last Friday.
PLATINUM posted its biggest weekly loss since December 2017 last week, as the metal suffered from weakening demand and oversupply. In a recent report, the World Platinum Investment Council forecast a high supply surplus through this year.
PALLADIUM could be facing its first monthly loss in eight months this month as investors take some profits following its stellar long-term run. Speculative accounts were net sellers for a second consecutive week in the week to March 5, the latest data snapshot from CFTC shows. Net long positions are now at their lowest since the week of January 29.
Not everybody sees palladium’s bull-run ending soon. Bank of America raised its 2019 forecast for palladium to $1,800 per ounce, a 22% increase from its previous estimate, according to a client note yesterday. It added that the precious metal could rally as high as $2,000 per ounce.
Palladium Monthly Chart
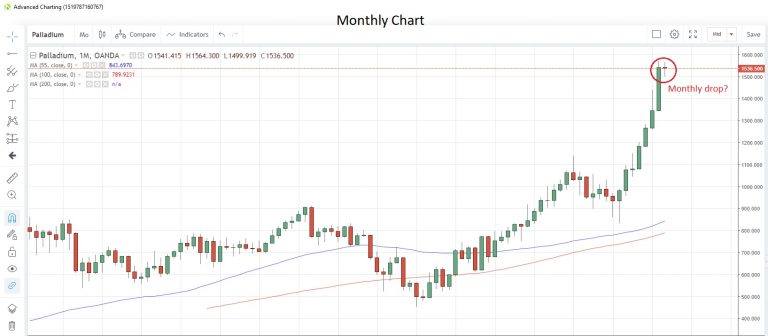
Source: OANDA fxTrade
Base metals
COPPER looks set for a second day of gains as it rebounds from near three-week lows. The industrial metal had been on the three-day downward track at the end of last week as data showed China’s copper imports fell 0.6% y/y in the January-February period. Note, data at the start of the year is always impacted by the timing of the Lunar New Year holidays and the first two months’ data are usually aggregated.
The Shanghai Futures Exchange noted that copper stockpiles tracked by it rose to the highest in eight months, suggesting copper may struggle to make significant gains unless demand picks up. However, speculative investors remain bullish as they boosted the net long positions to the highest since the week of June 26, the latest CFTC data as of March 5 showed.
Energy
CRUDE OIL has been trading in a tight $54.4-$57.6 range for almost a month now as OPEC’s attempt to squeeze prices higher by production caps is countered by increased output from US fields. The Paris-based IEA issued its medium-term report and predicted that America’s shale oil production increases will extend to 2024, almost negating the planned cuts in production from OPEC and its allies.
Prices need to break through the $58 barrier to have any attempt to test the 50% retracement of the October-December drop at $59.653 and the 200-day moving average at $62.077. The weekly API crude inventories data to March 4 is due later today after showing a surprise increase in stockpiles of 7.29 million barrels, the most since October last year. The Baker-Hughes rig count data last Friday showed the US rig count fell by 9 in the week to March 8, the third weekly decline in a row.
West Texas Intermediate Daily Chart
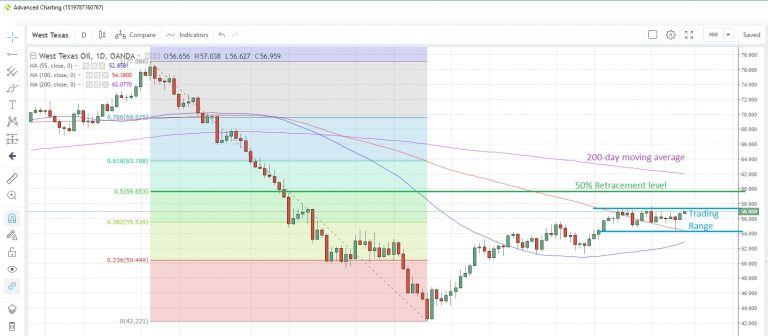
Source: OANDA fxTrade
NATURAL GAS is struggling for traction and fell the most in a month yesterday. The commodity is suffering from the customary supply/demand dynamics as warmer temperatures across the western US temper demand, while supply remains ample. Despite this, EIA storage data showed another drawdown of inventories in the week to March 4, this time 149 billion cubic feet and adding to the 177 billion the previous week. Inventories have fallen for the past 15 weeks yet prices have been unable to rally. Natural gas is now at 2.773.
Agriculturals
WHEAT equaled the lowest in more than a year this morning as the commodity is pressured by the latest crop forecasts. The US Department of Agriculture’s World Agricultural Supply and Demand Estimates (WASDE) report published Friday sees higher supplies, lower exports, slack domestic demand and larger stockpiles for wheat. Meanwhile in separate report, the United Nations forecast that global output of wheat could climb 4% this year. There’s nothing bullish in those two reports.
Speculative investors are already bearish on the commodity, with short bets at the highest since January 2018 after being net sellers for a fourth straight week, CFTC data showed. Wheat is now at 4.211.
SOYBEAN prices shrugged off news that China was buying US soybeans on Monday. Year-to-date soybean imports are down 14.9% y/y at 11.83 million tones, with February imports at 4.456 million tons, according to customs data. Speculative accounts are at their most bearish since November last year. Prices touched 8.756 yesterday, the lowest since December 28. Soybeans are now trading at 8.768.
SUGAR is attempting a rebound from just over two-month lows, posting modest gains for the past two days, as questions were raised about Brazil’s expected bumper crop, with wetter-than-usual weather conditions affecting the country’s centre-south cane-growing areas. There are hopes that India’s plans to increase the ethanol blending in petrol to 20% from 10% could help reduce current oversupply conditions in the country.
Speculative investors turned net sellers for the first time in four weeks, according to data to March 5 supplied by CFTC. Sugar closed at 0.12345 (what a nice number!) yesterday with the 55-day moving average at 0.1249.
CORN is struggling at five-month lows after the WASDE report pegged US corn stockpiles at 1.835 billion bushels, which was higher than analysts had forecast in a Bloomberg survey, and the USDA predicted smaller US exports this year. The supply situation prompted speculative investors to increase net shorts to the highest since January 2018 as they were net sellers for a fourth straight week, the latest CFTC data to March 5 showed. Corn is now at 3.532.
Author

Andrew Robinson
MarketPulse
A seasoned professional with more than 30 years’ experience in foreign exchange, interest rates and commodities, Andrew Robinson is a senior market analyst with OANDA, responsible for providing timely and relevant market commentar


