Clear analogies for Gold, Silver, and miners

What a (-n absolutely unsurprising) big slide in gold!
Not just a daily decline
I’ve been writing about the link to the 2011 double-top for some time now, and I’ve been emphasizing the back-and-forth nature of the correction.
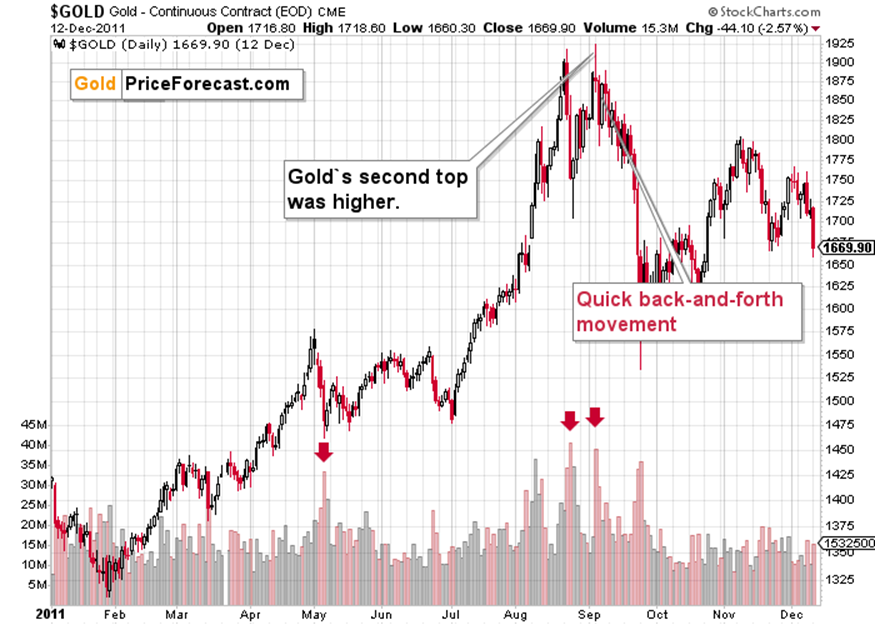
What seems to have gone under the radar of many is that since the major top IS most likely in, then the emphasis in the above is on FORTH.
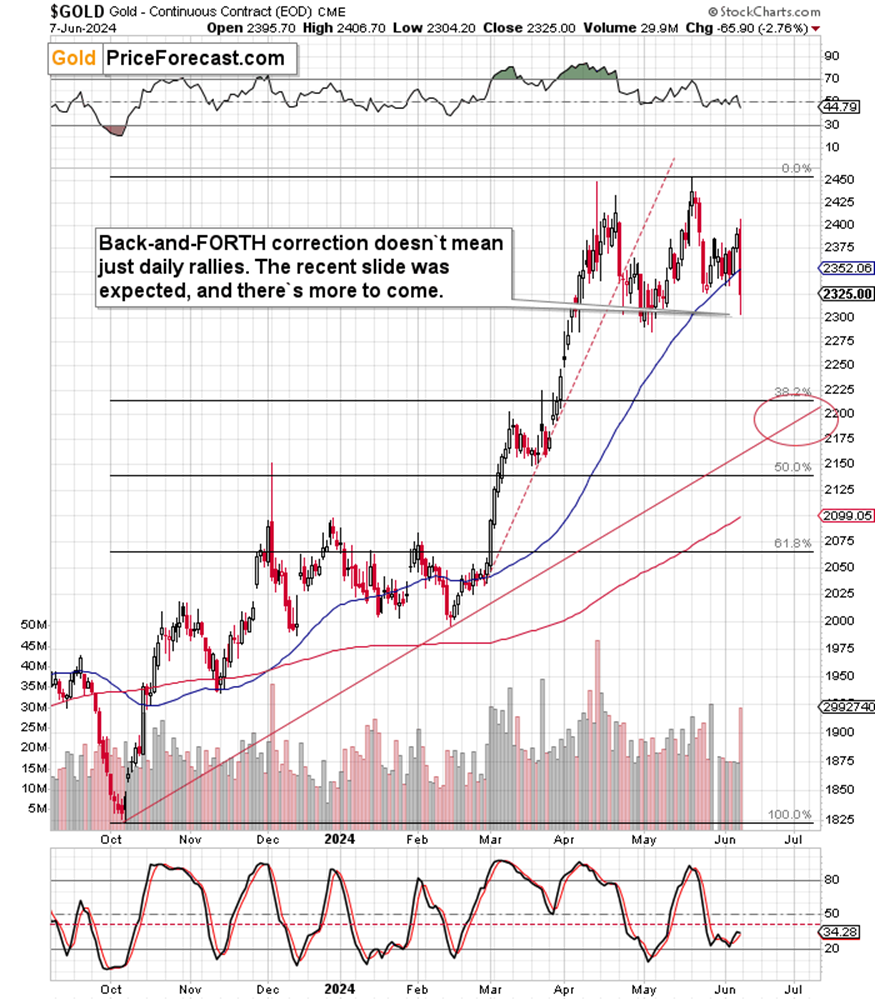
Friday’s slide was a really decisive “forth”. It was one of the biggest daily declines of the past years. But no, it’s not the end of the move lower; it has only begun.
- “But it’s just a daily decline, there’s nothing special about it as gold is still above its May high”
It’s true that gold hasn’t broken below the May low yet, but it’s also true that there’s more to the view on the current situation than just gold. And there are other signs confirming that “this is big” other than the size of Friday’s slide.
Take silver, for example. Based on how silver soared above $30 and how meme stocks (GME) jumped in price recently, I wrote that it was 2021 all over again – with the same bearish implications.
Interestingly enough, after I wrote that, silver plunged and then rallied back above $30 and the 2021 high, likely making some people think that silver simply verified its breakout while forgetting about the bigger picture (the above-mentioned analogy). And what happened next?
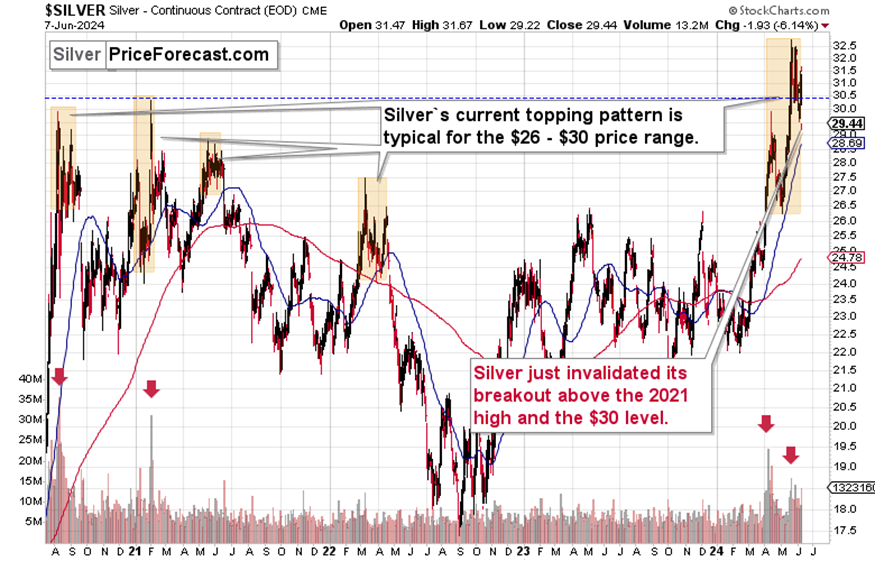
Silver plunged even lower!
With a weekly close at $29.44, it’s crystal-clear that the breakouts above the 2021 high and above the $30 level were indeed invalidated.
Oh, and speaking of weekly price moves…
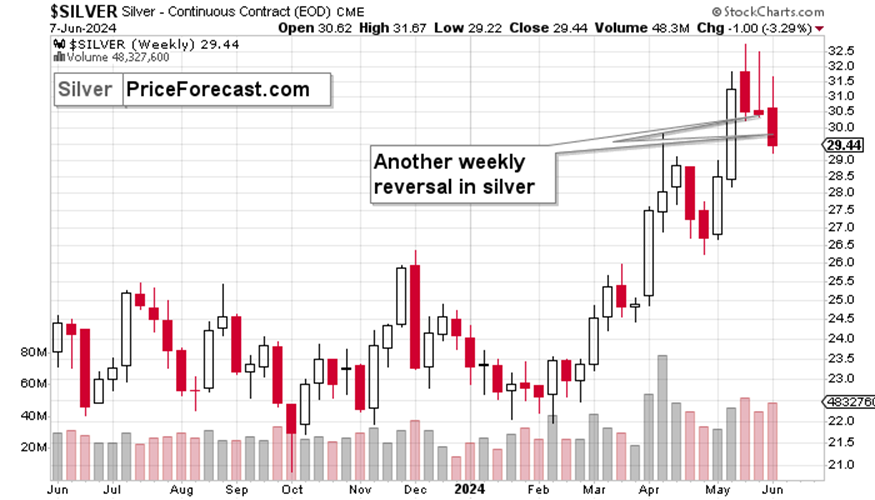
Silver formed a bearish weekly reversal for the third week in a row, with lower intraweek highs.
It would be difficult to come up with a more bearish combination of three weekly candlesticks.
If silver is to slide based on the 2021 analogy, then it could drag gold along with it. Could, because in early 2021, gold didn’t decline as much as silver did.
However, it’s not only silver that’s telling us that this is a massive decline getting started.
GDXJ’s warning
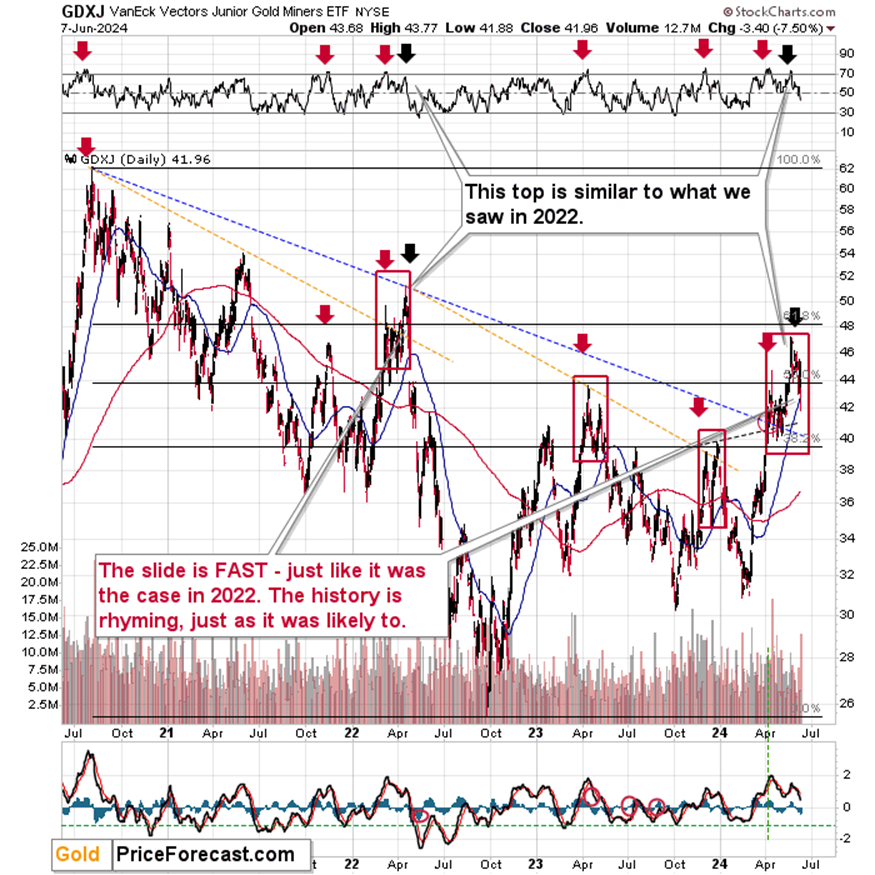
The GDXJ, the junior miner ETF (it includes mid-tier miners as well) has its own analogy and it’s ALSO pointing to much lower prices ahead.
Junior miners just plunged by 7.5%, with barely any help from the general stock market.
I’ve been warning about the link to the early-2022 top for many weeks, and the situation continues to develop in line with what we already saw. The history is rhyming.
The sharp rally that we saw in 2022 ended with an initial, volatile top, then GDXJ consolidated and then it broke higher which was a fake move. The invalidation of the breakout didn’t happen immediately, but when it happened, it was very sharp.
This is EXACTLY what we saw on Friday, and it happened after similar price pattern. Sharp rally, then a volatile top, then a consolidation and a fake breakout. Even the action in the RSI was similar, which I marked on the above chart in its upper part.
Getting more convinced that Friday’s daily slide in gold was actually something BIG? Now look at this:
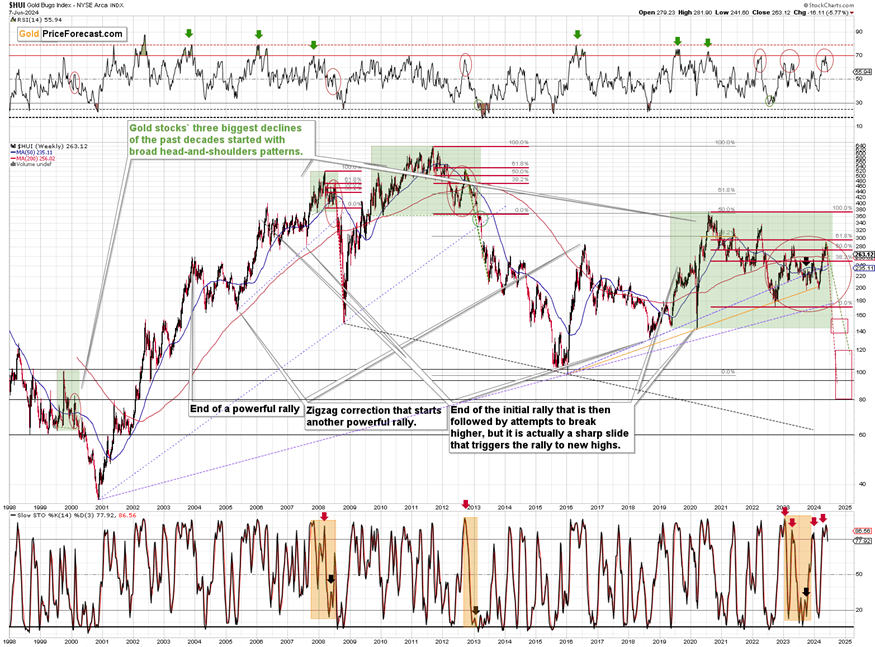
That’s the long-term HUI Index (a proxy for gold stocks) chart that shows how the current situation is similar to what we saw before two of the biggest slides of the previous decades: the 2008 slide and the 2012-2013 slide.
What we just saw was most likely the top of the right shoulder in a very broad head-and-shoulders formation. I marked all of them with green rectangles. What’s particularly characteristic is that the right shoulder corrected about 61.8% of the initial “head” decline. That happened in 2008, in 2012, and right now, in 2024.
Given Friday’s slide, gold stocks declined back below the 38.2% retracement. And you know what happened when we saw something like this in 2008 and 2012? The declines then continued. There were only very short-term rebounds but no medium-term rallies until MUCH lower levels were reached.
We were in the “PR is ridiculous as miners are soaring”, we’re in the “PR might be on to something, but this still FEELS bullish”.
I don’t want to say that I will definitely be right regarding the huge decline – nobody can guarantee something like that. What I do want to tell you is that it seems very likely (actually, you be the judge), and that when we get into the “PR was right all along”, the opportunity that we have now will be GONE.
Oh, and did I mention the situation on the forex market?
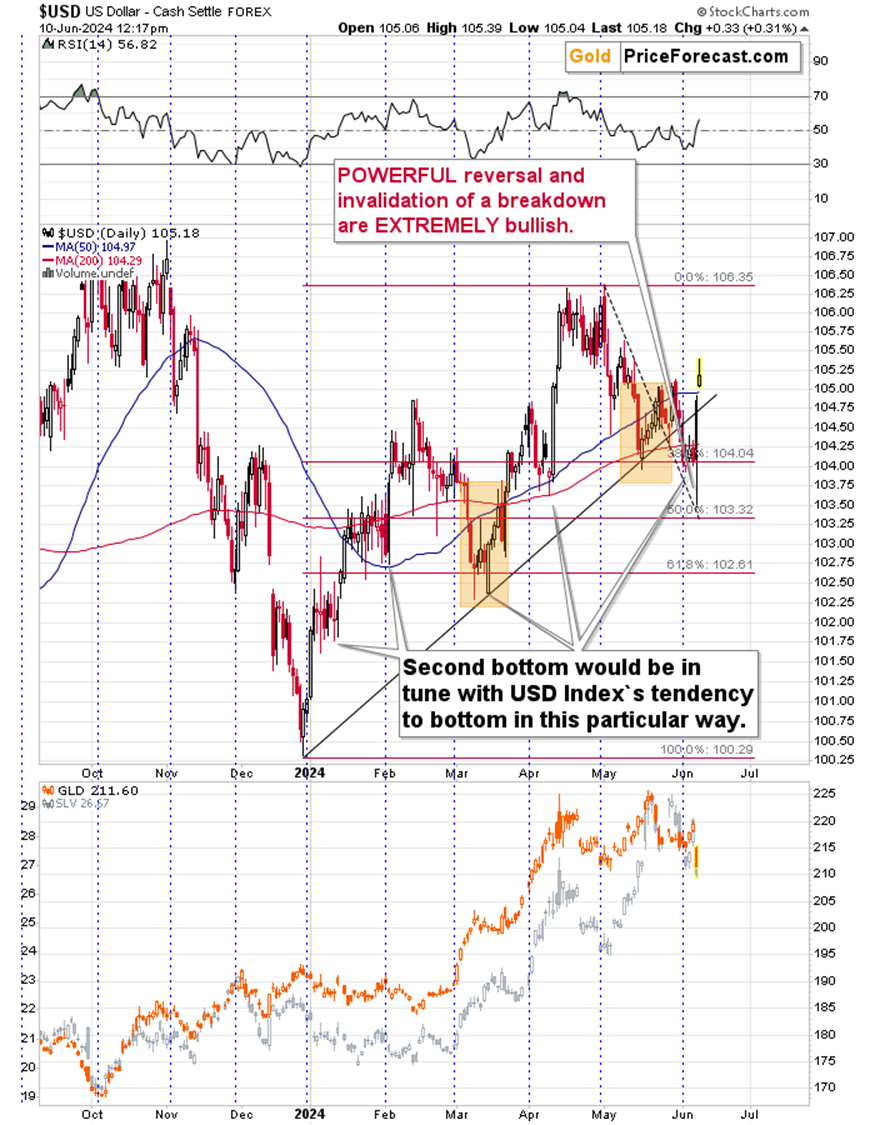
The USD Index soared, invalidating the previous breakdown in an extremely strong manner, and after correcting half of the recent rally.
The bullish reversal that we just saw on a daily basis and today’s rally suggest that this move up will continue.
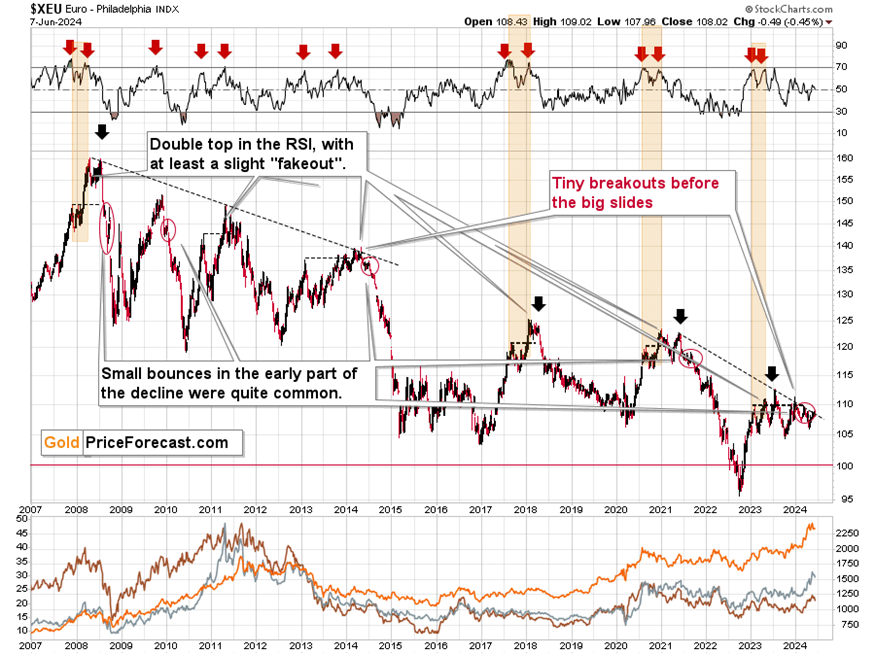
The opposite is likely for the EUR/USD – the biggest component of the USD Index. It’s after a broad top, similar to what we saw previously before big declines. And since it’s still very close to its declining, medium-term resistance line, it seems that the downside potential is huge.
The same goes for the precious metals sector, in particular mining stocks.
Of course, while miners might not have meaningful corrections during their huge slide, it might not apply to gold – we might see a tradable rally even as early as this month, but it’s too early to say with certainty at this moment.
Thank you for reading my today’s free analysis. Like I wrote earlier today, the current opportunity (actually, there’s more than one on the horizon) will likely not be here for much longer. I’ll do my best to navigate my Gold Trading Alert subscribers through the volatile waters, and I invite you to join them before it’s too late.
Want free follow-ups to the above article and details not available to 99%+ investors? Sign up to our free newsletter today!
Want free follow-ups to the above article and details not available to 99%+ investors? Sign up to our free newsletter today!
Author

Przemyslaw Radomski, CFA
Sunshine Profits
Przemyslaw Radomski, CFA (PR) is a precious metals investor and analyst who takes advantage of the emotionality on the markets, and invites you to do the same. His company, Sunshine Profits, publishes analytical software that any


