China’s first data dump of 2025 beats expectations

Key Chinese hard data beat conservative market forecasts to start the year on a strong note as the recovery in domestic demand continues.
Property remains a major drag on the economy as prices and investment have yet to bottom out
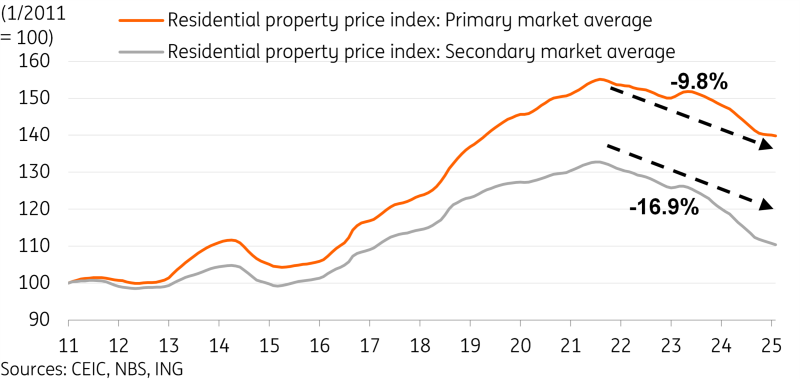
China's new home prices and existing home prices continued to slide month-on-month, registering at -0.14% and -0.34%, respectively, in February, suggesting that the long-awaited bottoming our of prices may take at least another month. The data from the National Bureau of Statistics, based on property price data for 70 cities, compares to -0.07% and -0.34%, respectively, in January. The February decline was relatively modest compared to much of 2024. Overall, prices are now down 9.8% and 16.9% from the peak for new home and existing homes, respectively. But the pace of decline has slowed noticeably in the past few months.
Looking at the city breakdown, we saw primary market prices rise in 18 cities. Seven cities saw prices flat on the month, and the rest saw prices decline. The decline in new supply to the market, combined with gradually improving sentiment, helped the new home market continue to show signs of recovery. However, the secondary market was notably softer, with only three cities seeing price increases, two with flat prices, and the rest seeing prices fall.
The stabilisation of the market is starting with the tier 1 and 2 cities, where there is a stronger demand backdrop to underpin the recovery.
Stabilising the property market has been a constant goal of policymakers this year. February's data showed that it would be wise for officials not to take their foot off the pedal in terms of policy support. We expect prices will indeed find a trough in 2025, though an L-shaped recovery is more likely than a U or V-shaped recovery.
However, stabilising property investment could remain further off. Other than seeing prices bottom out, we also likely need to see inventories normalise before property developers begin to ramp up new investment again. This process will likely be rather uneven, as developers will likely be more selective in where to build. In the first two months of the year, property investment remained well in contraction territory at -9.8% year on year, year to date, which was a smaller contraction than the -10.6% YoY level in 2024.
Property prices have yet to confirm bottom but have seen smaller declines in past few months
Retail Sales accelerated as the gradual consumption recovery continued
Consumption continued its gradual recovery momentum, as retail sales rose to 4.0% YoY ytd in the first two months of the year, beating market expectations and matching our forecast. This growth rate was up from the 3.5% YoY level in 2024.
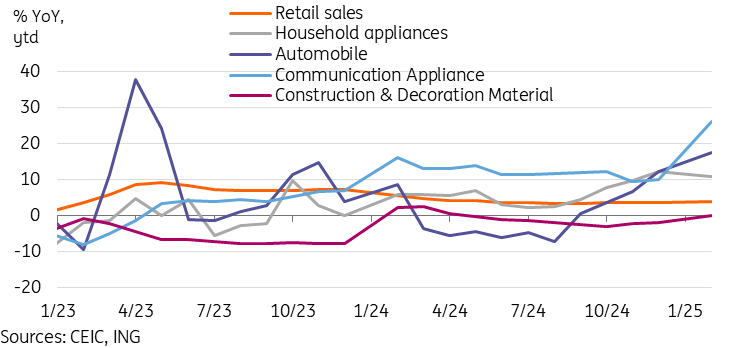
Trade-in policy beneficiaries, which include automobiles, home appliances, home renovation and decoration materials, electric bicycles, and electronics such as mobile phones, tablets, and smartwatches, will likely outperform headline growth. We’re already seeing some signs of this in the data from the first two months of the year, with the communication appliance category leading the way with a 26.2% YoY ytd growth. Also, we’re seeing strong performances in the household appliances (10.9%) and furniture (11.7%) categories. The glaring exception among the beneficiary categories was auto sales, which slumped to -4.4% YoY ytd.
The "eat, drink, and play" theme which we have been highlighting for the past year also continued its outperformance, with sports and recreation (25.0%), tobacco & alcohol (5.5%) and catering (4.3%) all growing faster than the headline growth.
The barometer for a more sustainable consumption recovery will likely be the other discretionary consumption categories. These got off to a decent start in 2025, with gold and jewelry (5.4%), cosmetics (4.4%), and apparel (3.3%) faring comparatively better after repeatedly underperforming in 2024.
Over the weekend, Chinese policymakers "unveiled a special action plan" to boost consumption. Considering this year's policy focus and last year's relatively low base, we expect consumption growth recover to mid-single-digit growth overall in 2025.
Trade-in policy beneficiaries off to a good start in 2025 with autos as the key exception
Value added of industry comfortably beat expectations
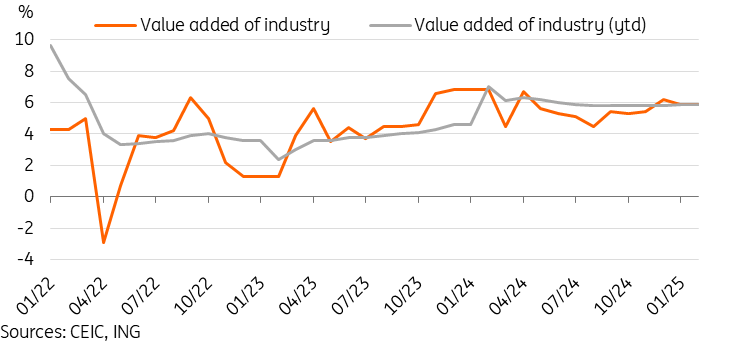
The value-added of industry rose to 5.9% YoY ytd, up from 2024's 5.8% YoY level, coming in well above consensus forecasts and our expectations. Recent soft export and purchasing managers’ data signalled a sluggish start to the year for industrial activity. But hard data releases showed stronger-than-expected growth.
By key industry, the main areas of strength from last year continued into 2025. The rail, ships, and aeroplane category led the way with 20.8% growth. The auto sector continued to see respectable growth of 12.0%. Hi-tech manufacturing in general continued to show strong growth at 9.1%.
In terms of products, we can see torrid growth in industrial robots (27.0%) and service robots (35.7%). One of this year's key themes was building out AI+ products. These robotics products could be a top beneficiary moving forward. However, construction-related products such as cement (-5.7%), flat glass (-6.1%) and crude steel (-1.5%) remained under pressure.
Moving forward, the key worry is if we will see slowing external demand start to impact manufacturing activity in China. The PMI data signalled contracting export orders for the past 10 months, but industrial activity has held up well for now. We expect domestic demand to recover this year. But if we start to see a greater impact on external demand from tariffs, it would be difficult for domestic demand to absorb all of the manufacturing capacity. Some moderation of the value-added of industry growth could be on the way in the coming months.
China's value-added of industry beat expectations despite soft export and PMI data
Fixed asset investment growth rebounded to highest since April 2024
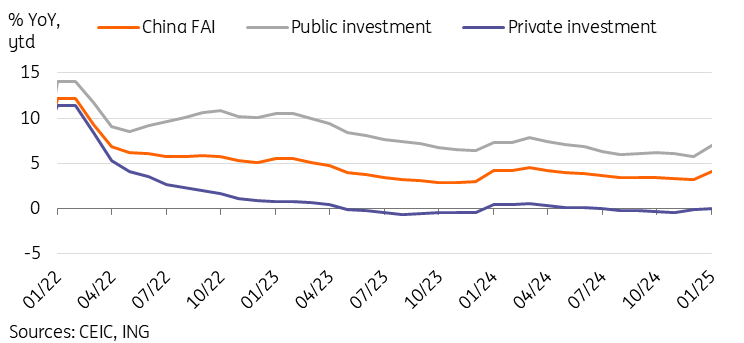
Fixed asset investment (FAI) growth rose to 4.1% YoY ytd in the first two months of 2025, up from 3.2% YoY in 2024. The figures came in well above market forecasts for 3.2% growth to start the year.
Public investment continues to account for all of the growth, up 7.0%, while private investment remained stagnant at 0.0%. By category, manufacturing (9.0%) and utilities (25.4%) FAI remained the key sources of strength.
Foreign companies remained cautious, registering a 10.0% YoY decline over the first two months of the year. Increased trade tensions and policy uncertainty could continue to hamper this growth despite efforts to attract foreign investment to return to China.
We are expecting a mild recovery of FAI growth this year, as last year's RMB 10tn fiscal package will help free up more local governments to enact fiscal stimulus, and this year's fiscal targets were also set to allow for more aggressive stimulus action, though unlike in the past, more of these resources will be deployed to supporting consumption this time around. The equipment renewal subsidy programme will help encourage FAI growth, but weak private sector sentiment looks likely to continue to drag on overall growth.
Public sector driving FAI growth as private sector remains a headwind
Forecast revisions
We are upgrading our 2025 GDP growth forecasts from 4.6% YoY to 4.7% after the economic target setting at this year's Two Sessions signalled confidence in stabilising demand. The first two months of hard economic data has come in on the strong side as well. Significant uncertainties remain, but we feel that upside and downside risks are roughly evenly balanced from the new forecast at this juncture.
China rarely fails to achieve its growth target, and we expect that policy support will continue to roll out to help offset the tariff impact on growth this year.
Read the original analysis: China’s first data dump of 2025 beats expectations
Author

ING Global Economics Team
ING Economic and Financial Analysis
From Trump to trade, FX to Brexit, ING’s global economists have it covered. Go to ING.com/THINK to stay a step ahead.