CHF/JPY: Is the Bull ready to continue its ride?

CHF/JPY had a very bullish day yesterday. The price made an upside breakout on the daily chart. Thus, the buyers may wait for bullish momentum to go long on the pair. If it makes an upside breakout at yesterday’s highest high, the pair may remain bullish on the daily chart for a few days. Today’s intraday price action has been bearish so far. That suggests that the price may produce a bearish corrective candle today. Let us find out the levels that may hold the price as support and make the pair more bullish.
Chart 1 CHF/JPY Daily Chart
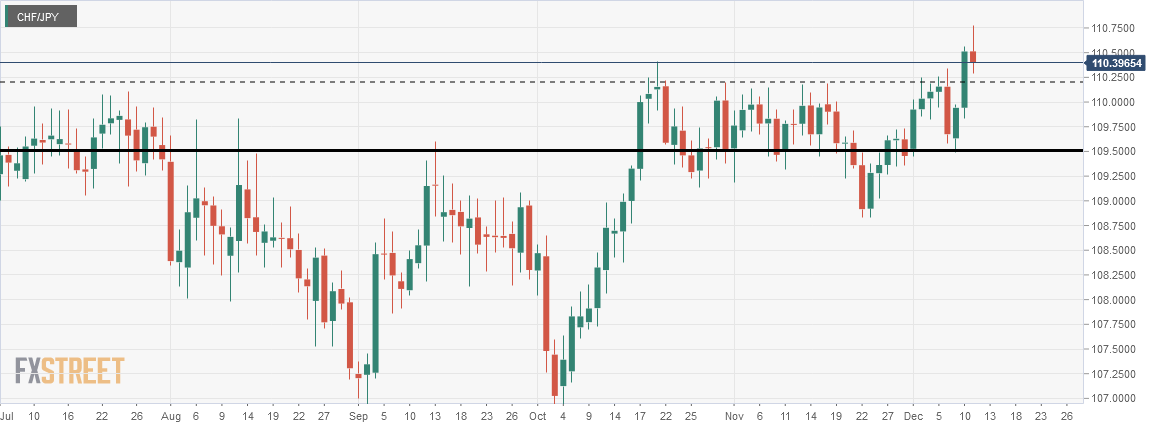
The chart shows that the first bullish reversal candle formed at the level of 109.5000. This was an Inside Bar, but it was good enough to push the price towards the upside. So. the price yesterday went towards the North and made a breakout at around the level of 109.2500. Today’s price may produce a corrective wave, which may make the candle as a bearish candle in the end. The fact remains, any upside breakout at yesterday’s highest high may attract the buyers to go long on the pair.
Chart 2 CHF/JPY H4 Chart
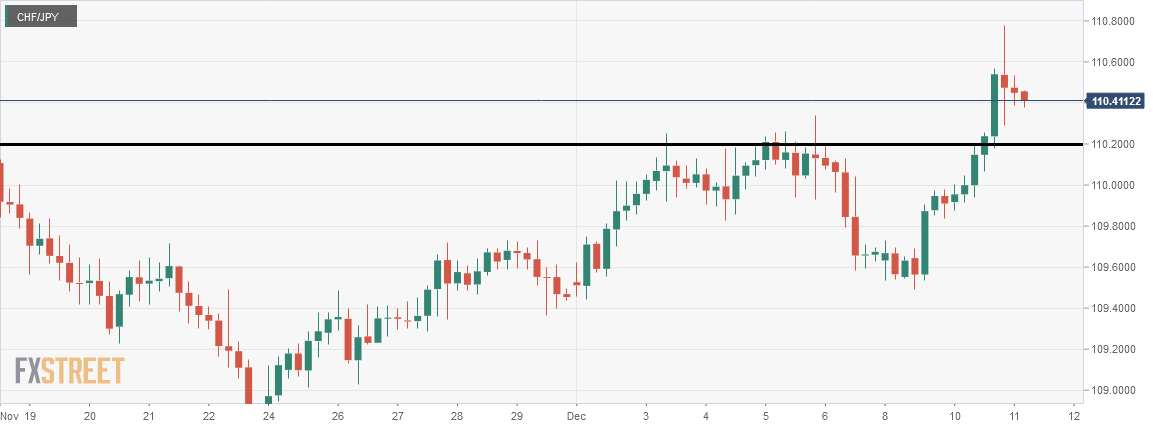
The H4 chart shows that the price has been heading towards the South. The breakout level may hold the price as a flipped support. If the level produces a bullish reversal candle, the H4 buyers may go long up to the level of 111.1270. The signal will be based on the ABC or 123 pattern, which is one of the most traded patterns by the Forex traders. The price may find its 1st resistance at the level of 110.7270 and the 2nd resistance at the level of 110.8810.
Chart 3 CHF/JPY H1 Chart
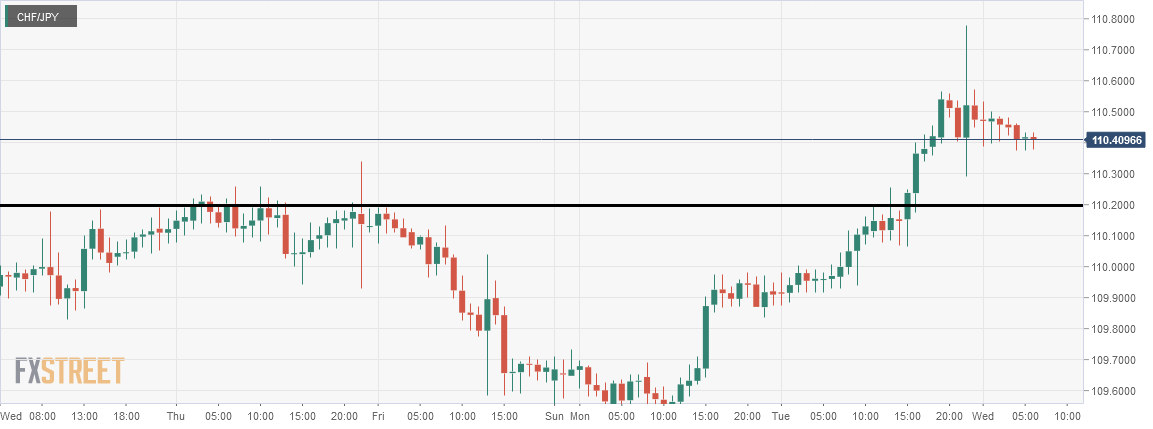
The H1 chart shows that the price has been slightly bearish biased. However, it does not look good for the sellers as far as the risk-reward ratio is concerned. The breakout level suggests that sellers on 5M, 15M may find out some short opportunities. Thus, the pair may remain bearish, but the overall selling pressure may not be that high.
The daily chart looks extremely good for buyers. The H4 chart looks a bit neutral, and the H1 chart looks a bit bearish. Since the daily chart favors the buyers, thus the buyers have the upper hand. If today’s candle comes out as another bullish candle or as a bearish Inside bar, the pair may remain bullish for a few days. With the support of the minor charts, if it comes out as a bearish engulfing candle, the equation may change only then.
Author

EagleFX Team
EagleFX
EagleFX Team is an international group of market analysts with skills in fundamental and technical analysis, applying several methods to assess the state and likelihood of price movements on Forex, Commodities, Indices, Metals and


