Chart of the week: AUD/USD testing bullish commitments at critical resistance area
- AUD/USD reaches the top of the rising wedge in a dominant downtrend and lacks fresh volume.
- AUD/USD meets tough resistance levels at this juncture despite trading through the 200-DMA.
- Bulls can aim for July peak and a 100% retracement confluence level, 0.7070/80.
- Bears will look for a break of 200-DMA and re-run to wedge support which meets 50% Fibo level, 0.6870.

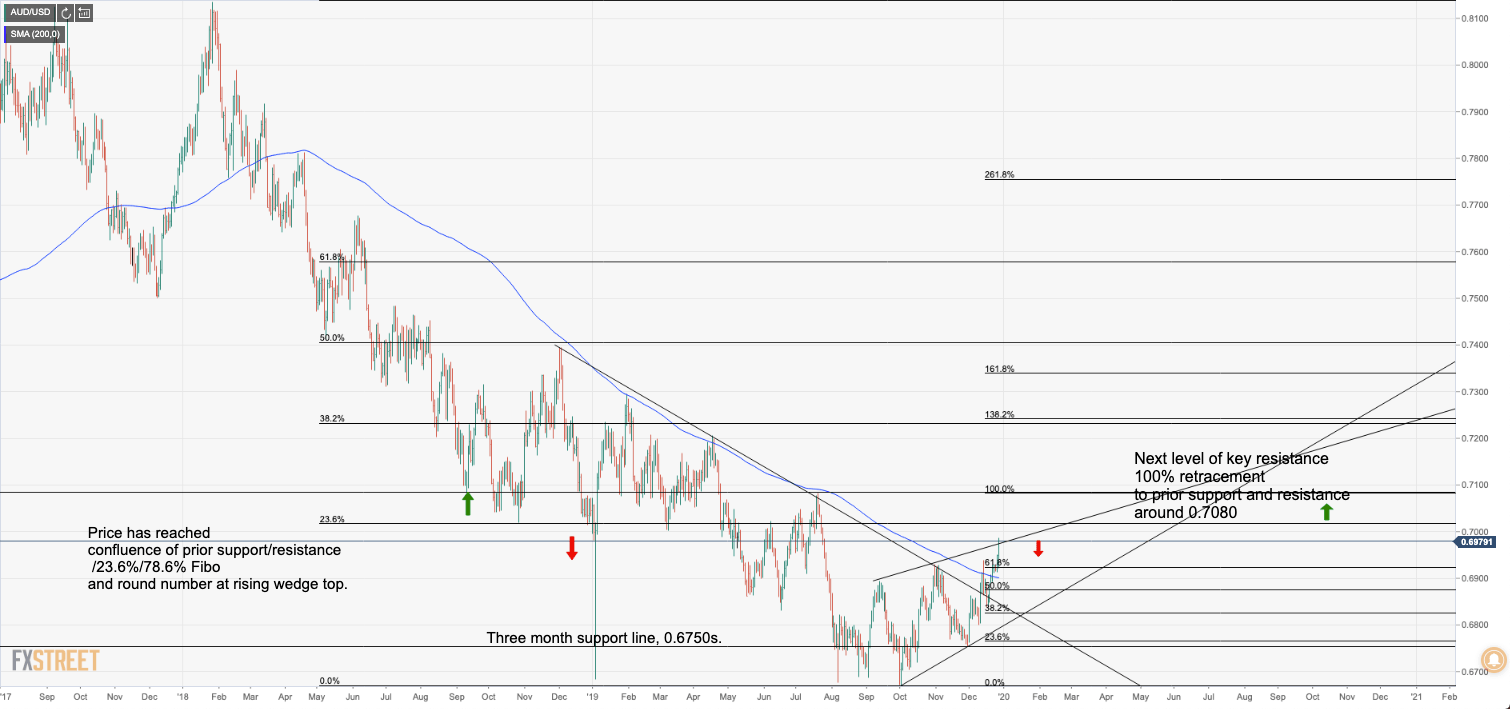
AUD/USD daily chart
Bullish scenario:
AUD/USD has risen to test the top of a rising wedge which has formed in a broader downside trend and vs negative fundamentals for the medium-term outlook. Therefore, a full-on bullish trend is not the bias at this juncture, although there is room for a continuation should the rising wedge's resistance break, but the scope looks limited to the July peak and a 100% retracement of those swing highs around 0.7077.
Bearish scenario:
In thin holiday trade, there has been a lack of volume and hence the case for a sell-off given the rising wedge formation in a downtrend is compelling. This scenario will open a run back to rising support to the 50% Fibo of said swing-range, just below the 0.69 handle, testing bullish commitments at the 200-DMA. Below here, support below the 55-day moving average can be found at the 0.6800 Dec. 10th low. We then have a three-month support line around 0.6755 as the November low.
Author

Ross J Burland
FXStreet
Ross J Burland, born in England, UK, is a sportsman at heart. He played Rugby and Judo for his county, Kent and the South East of England Rugby team.


