Chart of the Day: SPX500

The S&P breakout reaches key resistance!
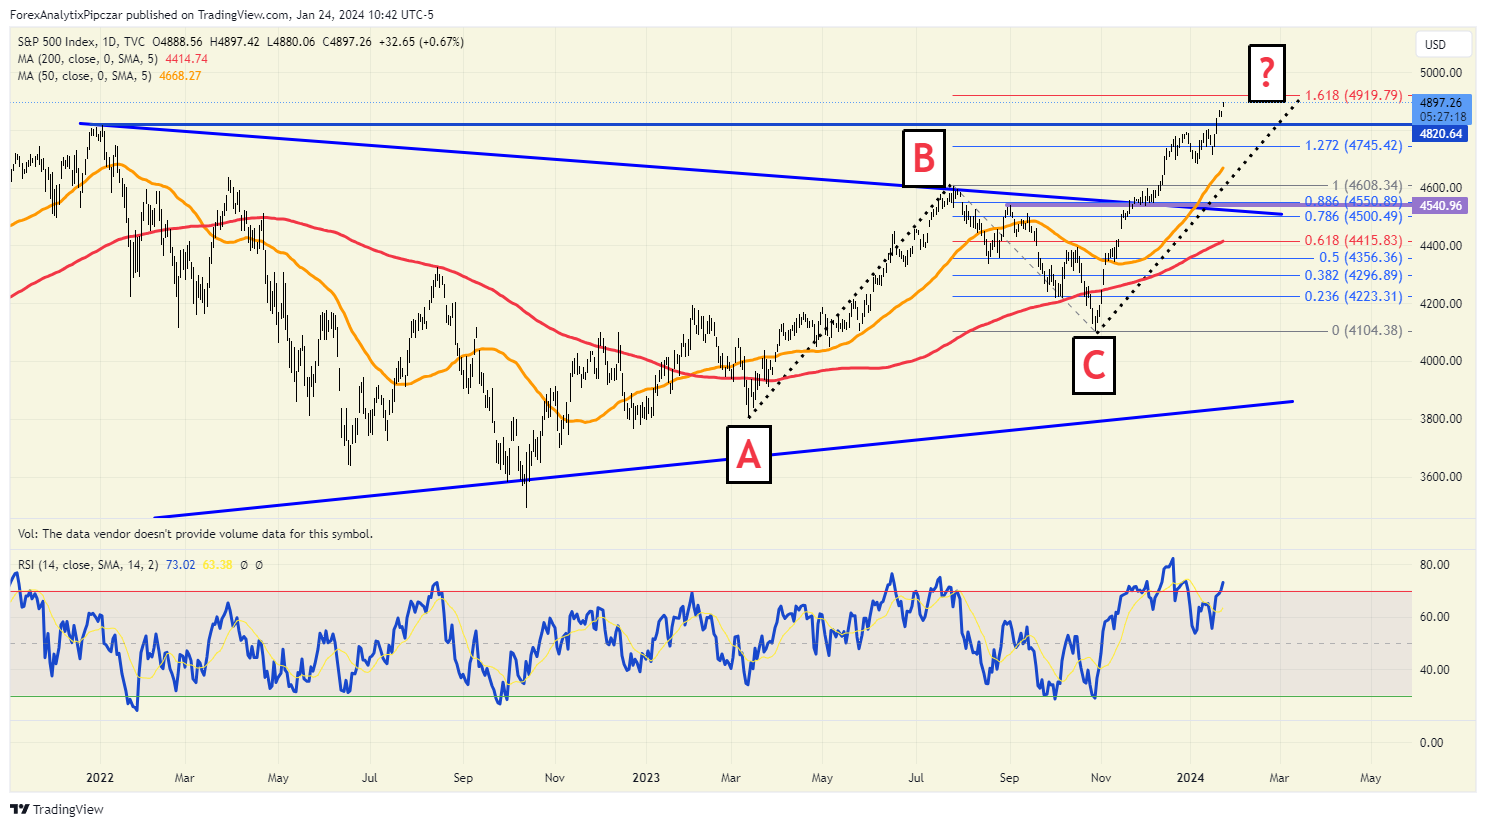
I don't think anyone can deny that we have broken out in the S&P500. Once we took out the highs last Friday, we have been rallying the whole week. However, we are now within points of a key resistance.
The 4920 level on the Tradingview CFD is 20 points away from the key 161% Golden Fibonacci extension (if you are using the ES contracts, we are roughly 30-40 points from 4967 which is the same extension). This level also represents the equal leg move of the March 2023 lows to July 2023 highs to the October 2023 lows. The glaring chart indicator for me is the very divergent RSI.
If the market stalls above the 4900 level, then breaks back below the 4800 level. I will say the near term (and maybe more long term) top is in the broad markets.
Author

Blake Morrow
Forex Analytix
Blake Morrow spent most of his professional career as the Chief Currency Strategist for Wizetrade group for 15 years, and then the Senior Currency Strategist for Ally Financial after the acquisition of Tradeking which owned the Wizetrade Group.


