|

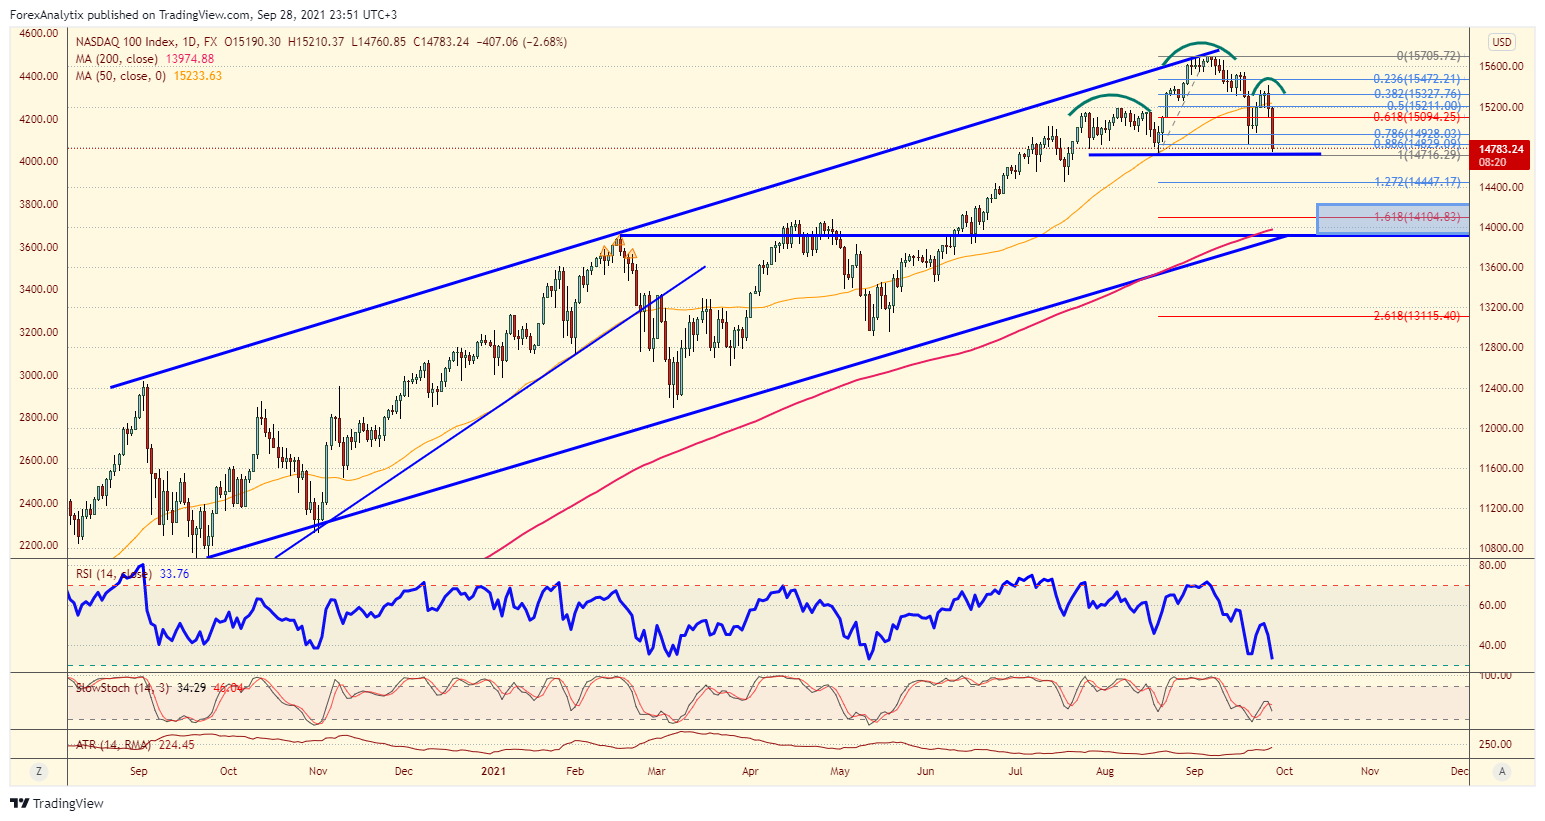
Chart of the day: Nasdaq 100

A month ago, wee had the Nasdaq 100 as our chart of the day and warned we were at the top of the channel with some strong divergent RSI. Since then, the index has rolled over and may be forming a head and shoulder pattern with the neckline near the 14700 level. A break of this level could allow for a move to the channel support and 161% Fibonacci golden extension of the last move higher at 14100.

Author

Blake Morrow

Blake Morrow

Forex Analytix

Blake Morrow spent most of his professional career as the Chief Currency Strategist for Wizetrade group for 15 years, and then the Senior Currency Strategist for Ally Financial after the acquisition of Tradeking which owned the Wizetrade Group.

More from Blake Morrow
Share:

Editor's Picks

EUR/USD treads water around 1.1900

EUR/USD edges a tad lower around the 1.1900 area, coming under mild pressure despite the US Dollar keeps the offered stance on turnaround Tuesday. On the US data front, December Retail Sales fell short of expectations, while the ADP four week average printed at 6.5K.

GBP/USD looks weak near 1.3670

GBP/USD trades on the back foot around the 1.3670 region on Tuesday. Cable’s modest retracement also comes in tandem with the decent decline in the Greenback. Moving forward, the US NFP and CPI data in combination with key UK releases should kee the quid under scrutiny in the next few days.

Gold flirts with daily lows near $5,000

Gold comes under marked selling pressure on Tuesday, giving back part of its recent two day advance and threatening to challenge the key $5,000 mark per troy ounce. The yellow metal’s correction follows a better tone in the risk complex, a lower Greenback and shrinking US Treasuty yields.

AI Crypto Update: BankrCoin, Pippin surge as sector market cap steadies above $12B

The Artificial Intelligence (AI) segment is largely on the back foot with major coins such as Bittensor (TAO) and Internet Computer (ICP) extending losses amid a sticky risk-off sentiment.

Dollar drops and stocks rally: The week of reckoning for US economic data

Following a sizeable move lower in US technology Stocks last week, we have witnessed a meaningful recovery unfold. The USD Index is in a concerning position; the monthly price continues to hold the south channel support.

XRP holds $1.40 amid ETF inflows and stable derivatives market

Ripple trades under pressure, with immediate support at $1.40 holding at the time of writing on Tuesday. A recovery attempt from last week’s sell-off to $1.12 stalled at $1.54 on Friday, leading to limited price action between the current support and the resistance.