Chalk this one up on the unverified hypothesis list
/definition-of-etf-21007500_XtraLarge.jpg)
I've seen at least 10 different versions of the following chart over the last two weeks.
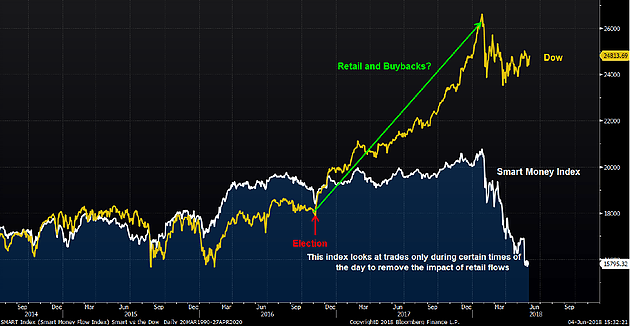
From the provider: "The Smart Money Flow Index is calculated by taking the action of the Dow in two time periods: the first 30 minutes and the close. The first 30 minutes represent emotional buying, driven by greed and fear of the crowd based on good and bad news. There is also a lot of buying on market orders and short covering at the opening. Smart money waits until the end and they very often test the market before by shorting heavily just to see how the market reacts. Then they move in the big way. These heavy hitters also have the best possible information available to them and they do have the edge on all the other market participants. To replicate this index, just start at any given day, subtract the price of the Dow at 10 AM from the previous day's close and add today's closing price. Whenever the Dow makes a high which is not confirmed by the SMFI there is trouble ahead."
The “theory” goes that when smart guys start selling at the end of the session, you should pack your bags and run for the hills. But maybe they don't drive as much of the late day flow anymore. And by now you probably know who I'm going to call out: Mr. Passive, and more specifically Mr. Levered Passive will you please put your hand up.
I remember reading the following article a while ago: "Intraday share price volatility and leverage ETF rebalancing - Shum, Hejazi, Haryanto and Rodier (2015)". Have a skim through if you want, but this is the key sentence: "We show that end-of-day volatility was positively and statistically significantly correlated with the ratio of potential rebalancing trades to total trading volume. The impacts were not all economically significant, but largest during the most volatile days"
I decided to recreate a similar index, using flows into levered ETFs on the US markets and comparing that to the smart money flow index. Guess what, the chart looks nice.
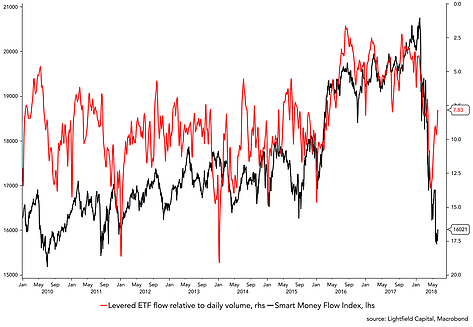
Could be a coincidence. Could be that I'm always pointing the finger to ETFs for anything. Or could it that smart money flow index is about to mysteriously pick up.
Author

Samuel Gruen
Lightfield Capital
Samuel Gruen is the founder and portfolio manager at Lightfield Capital. Prior to Lightfield he was a trader at Cube Capital, a $1.1bln multi-strategy fund with a 12 year track record.


