Cass Freight Index Contracts 8th Month: Cass Predicts Negative GDP by Q3 or Q4

Based on global shipping indexes, Cass expects a US GDP contraction in the third or fourth quarter.
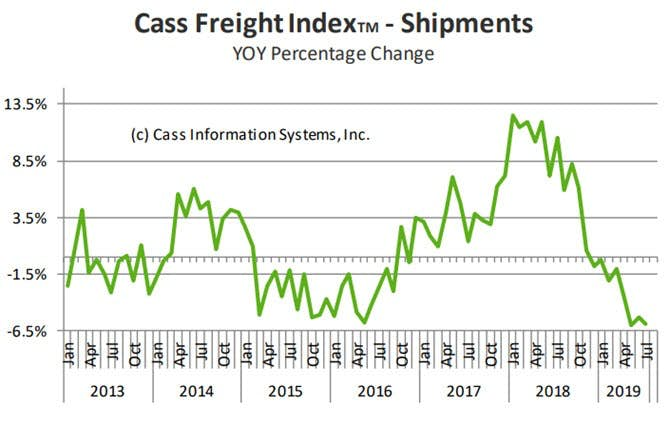
The Cass Freight Index® Report shows trucking shipments as negative for the 8th month.
Key Points
- When the December 2018 Cass Shipments Index was negative for the first time in 24 months, we dismissed the decline as reflective of a tough comparison. In January and February 2019, we again made rationalizations. When March was also negative (-1.0%), we warned that we were preparing to “change tack” in our outlook; when April was down (-3.2%), we said, “we see material and growing downside risk to the economic outlook.”
- With the -5.9% drop in July, following the -5.3% drop in June, and the -6.0% drop in May, we repeat our message from last two months: the shipments index has gone from “warning of a potential slowdown” to “signaling an economic contraction.”
- We acknowledge that: all of these negative percentages are against extremely tough comparisons; and the Cass Shipments Index has gone negative before without being followed by a negative GDP. However, weakness in demand is now being seen across many modes of transportation, both domestically and internationally.
- Although the initial Q2 ’19 GDP was positive, it was not as positive upon dissection, and we see a growing risk that GDP will go negative by year’s end.
- The weakness in spot market pricing for many transportation services, especially trucking, is consistent with the negative Cass Shipments Index and, along with airfreight and railroad volume data, strengthens our concerns about the economy and the risk of ongoing trade policy disputes. Weakness in commodity prices, and the decline in interest rates, have joined the chorus of signals calling for an economic contraction.
European Airfreight vs EuroZone PMI
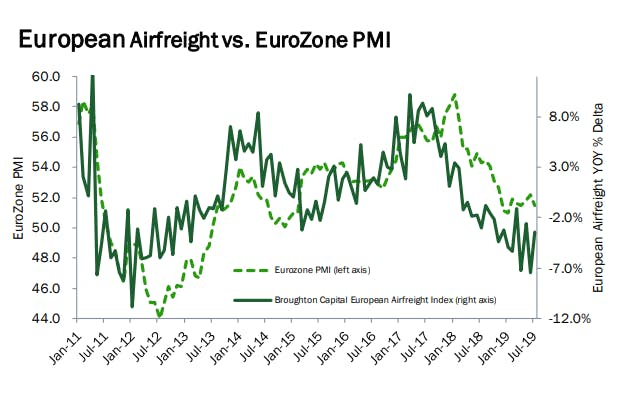
European airfreight volumes have been negative since March 2018, but only by small single-digit margins (-1% to -3%), until November 2018. Unfortunately, since then, volumes have started to further deteriorate. Our European Airfreight Index was down a concerning -7.2% in April, only down -2.6% in May, before dropping -7.5% in June. Our preliminary July index is only down -3.4%, and consistent with the deteriorating Eurozone PMI. While the -6.9% July overall drop in London airfreight volume suggests that economic headwinds from Brexit remain, particularly since the largest rates of decline (down -11% to -25%) are being experienced in the lanes between (to and from) London and other EU airports. Although the European data is by itself distressing, it’s the Asian data that has become the most alarming.
Asia Pacific Airfreight
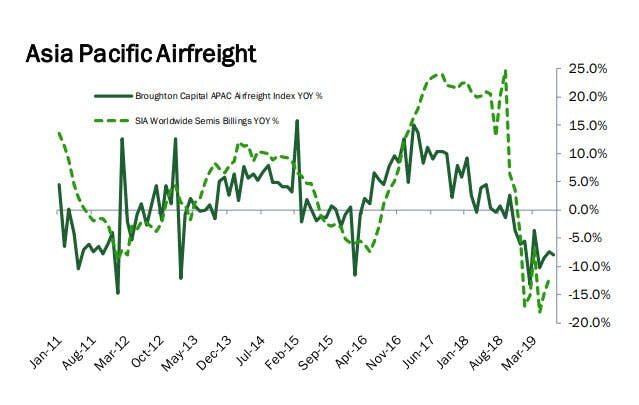
Asian airfreight volumes were essentially flat from June to October 2018, but have since deteriorated at an accelerating pace (November -3.5%, December -6.1%, January –5.4%, February -13.2%, March -3.6%, -10.2% in April, -8.5% in May, -8.6% in June, and preliminary July -7.9%).
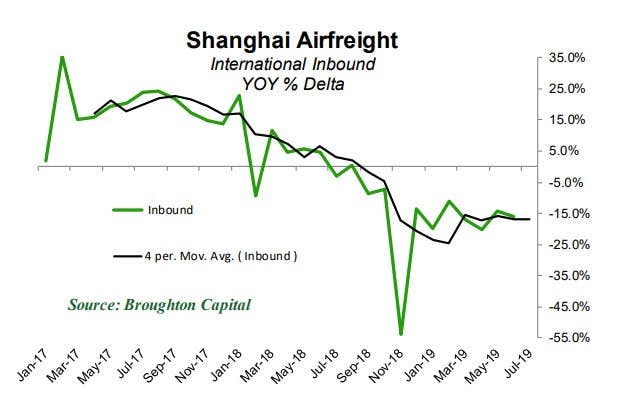
Shanghai Airfreight
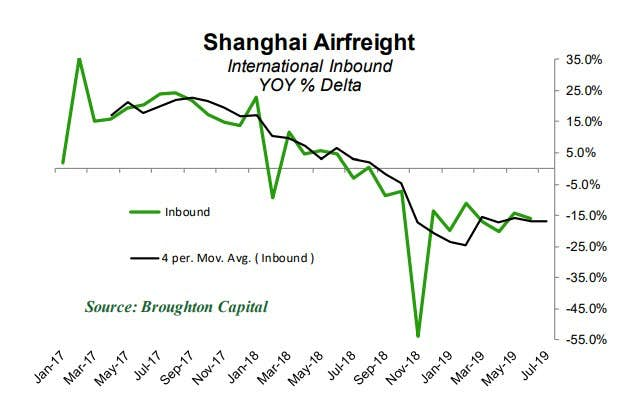
The volumes of the three largest airports (Hong Kong, Shanghai, and Incheon) are experiencing the highest rates of contraction.
Shanghai Airfreight Inbound vs Outbound
Shanghai Airfreight Inbound vs Outbound Tonnage
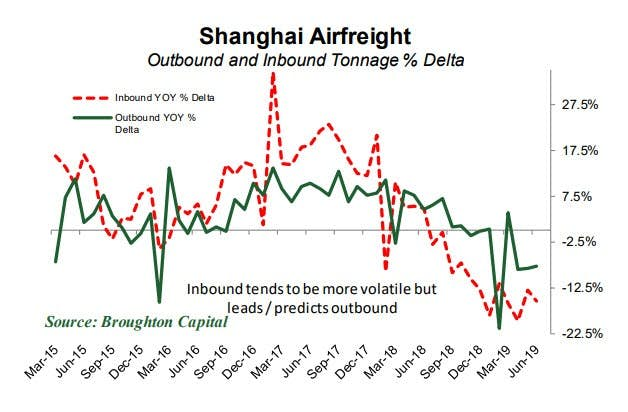
The inbound volumes for Shanghai have plummeted. This concerns us since it is the inbound shipment of high value/low density parts and pieces that are assembled into the high-value tech devices that are shipped to the rest of the world.
Hence, in markets such as Shanghai, the inbound volumes predict the outbound volumes and the strength of the high-tech manufacturing economy.
With the current level of civil unrest, leading to Hong Kong airport flight delays and cancellations, we can’t imagine that August data will be anything but worse.
Cass Shipments Index vs GDP
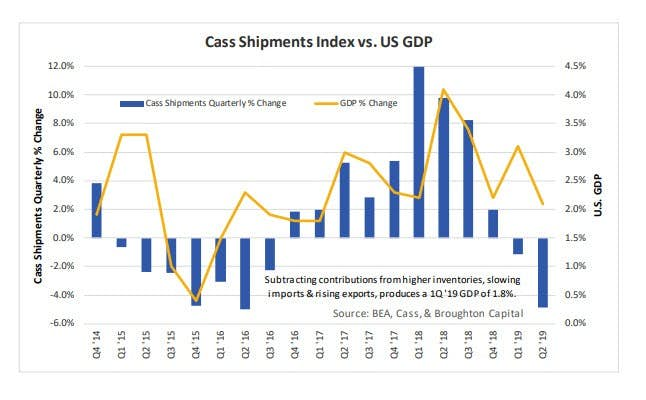
At first glance, the GDP for the 1st and 2nd quarter seems very inconsistent with overall freight volumes. Using the Cass Shipments Index as a predictive proxy, we did not expect the BEA to report 3.2% as its initial estimate or 3.1% as its revision in Q1 or 2.1% in Q2. As we have already explained, dissecting the contributing factors explains much of the disparity, and should point out that freight flows are a leading indicator. It often takes two to three quarters for the trends in freight to become reported economic statistics.
Although we also subdivide the economy via multiple other data feeds that represent smaller segments of freight flows, the Cass Freight Shipments and Expenditures Indexes are two of the strongest proxies for what is happening in the overall U.S. freight markets, and as a result they are strong predictive indicators for the U.S. economy.
Negative GDP in 2019
Based on all three months of data for Q2, the Cass Shipments Index is signaling that GDP may be negative, or at least come close to being negative, in Q3. If it does not, since reported GDP often lags the economic activity represented by freight flows, continued weakness in the Cass Shipments Index at the current magnitude should result in a negative Q4 GDP.
Industrial Production Supports Cass View
The Cass report is consistent with the today's Industrial Production report and the Global Manufacturing recession already underway.
- Tale of Two Economies: Industrial Production vs Retail Spending
- A Global Manufacturing Recession Started and Trump's China tariffs make matters much worse.
- Manufacturing Recessions vs Real Recessions: How Much Lead Time Do You Expect?
Cass suggests 1-2 quarters of lead time. Historically, lead time is zero on a quarterly manufacturing basis. See point 3 above.
Author

Mike “Mish” Shedlock's
Sitka Pacific Capital Management,Llc


