Can Treasury intervention keep the Gold rally alive?

Last week, we were watching one relationship in particular for gold: the spread between the U.S. 2-year and 30-year Treasury yields.
Our thesis was simple. When the 2-year rises faster than the 30-year, the spread moves higher and near-term Fed pressure becomes more restrictive. Gold has historically struggled in that environment.
When the spread trends lower, conditions tend to become more supportive.
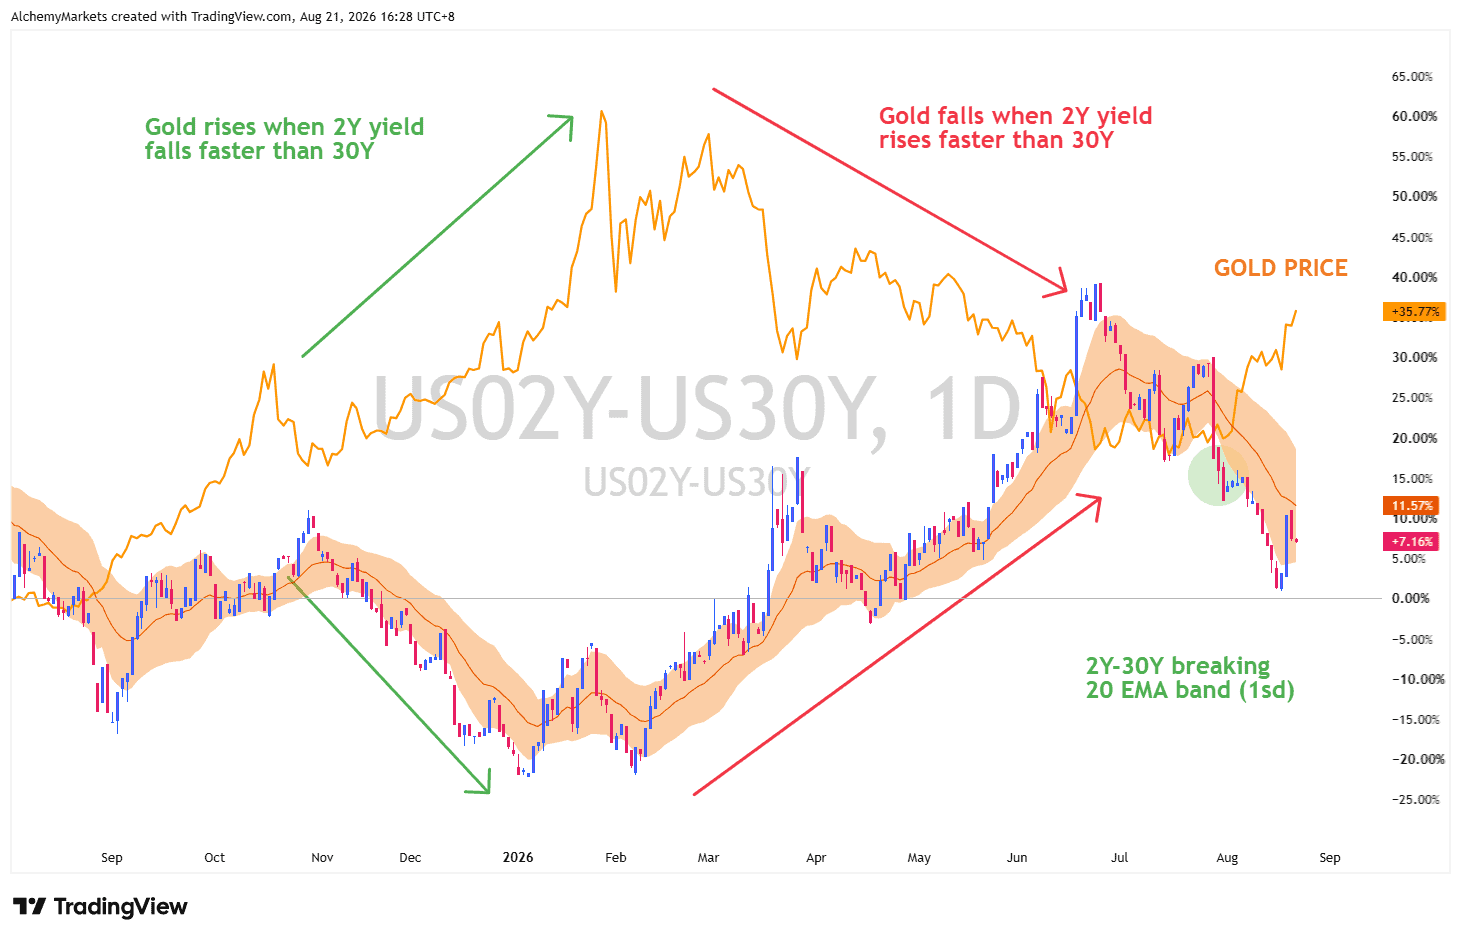
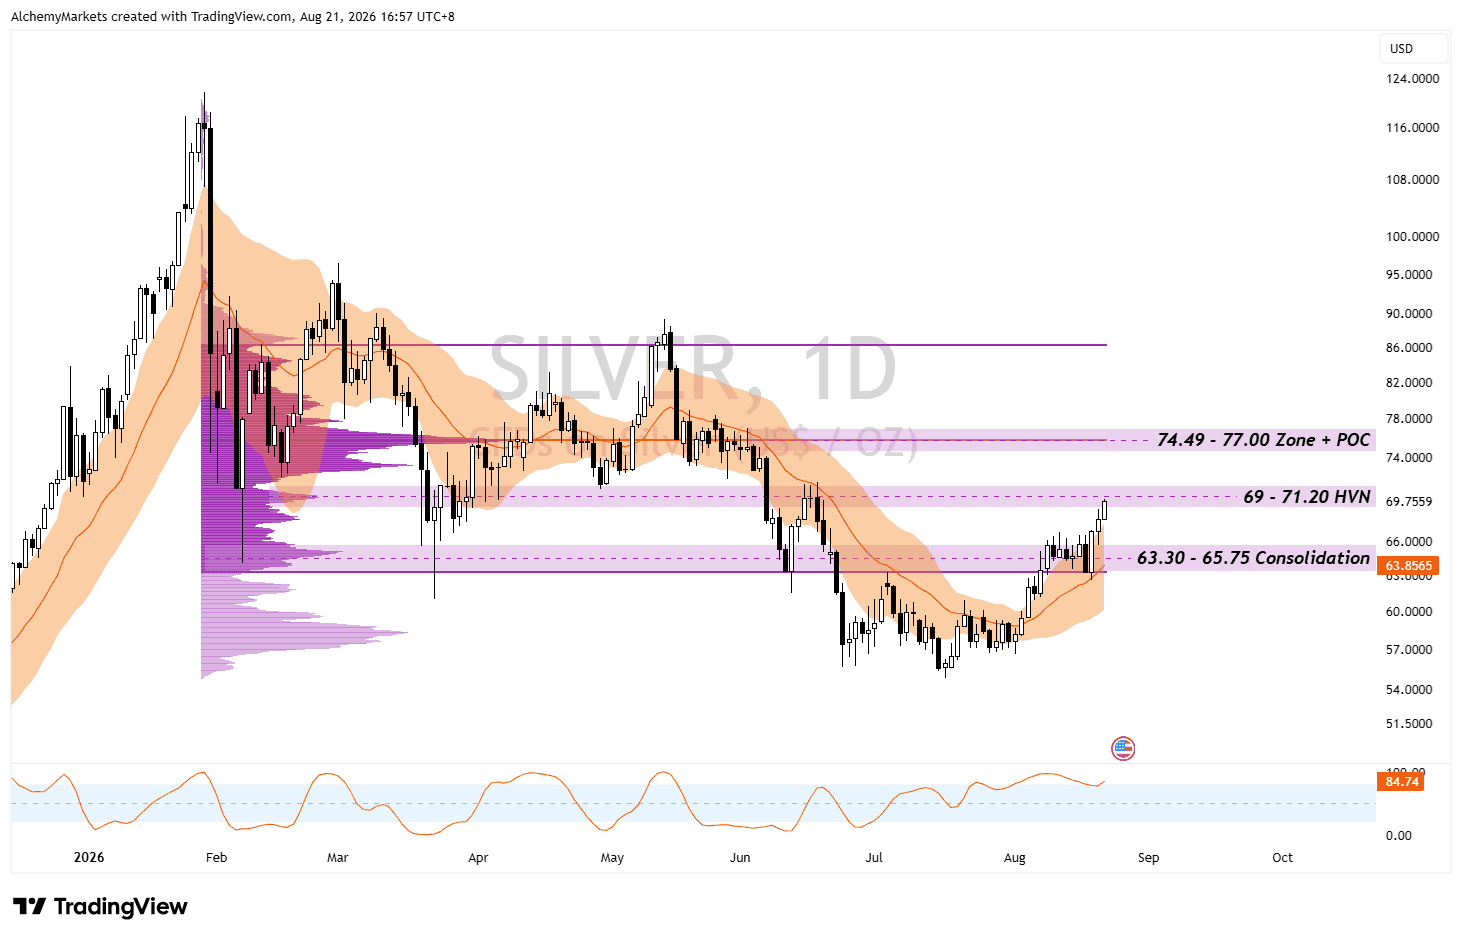
Earlier this month, the spread broke below its 20-day EMA trend band, measured with Bollinger Bands set at one standard deviation. Gold subsequently rallied towards $4,560, while silver climbed towards $70.
So the signal worked. The question now is whether it is still valid after Treasury stepped into the long end.
Treasury has entered the picture
After the 30-year yield reached roughly 5.3%, Treasury announced that long-end liquidity-support buybacks would increase from $2 billion to at least $4 billion per operation from September 9.
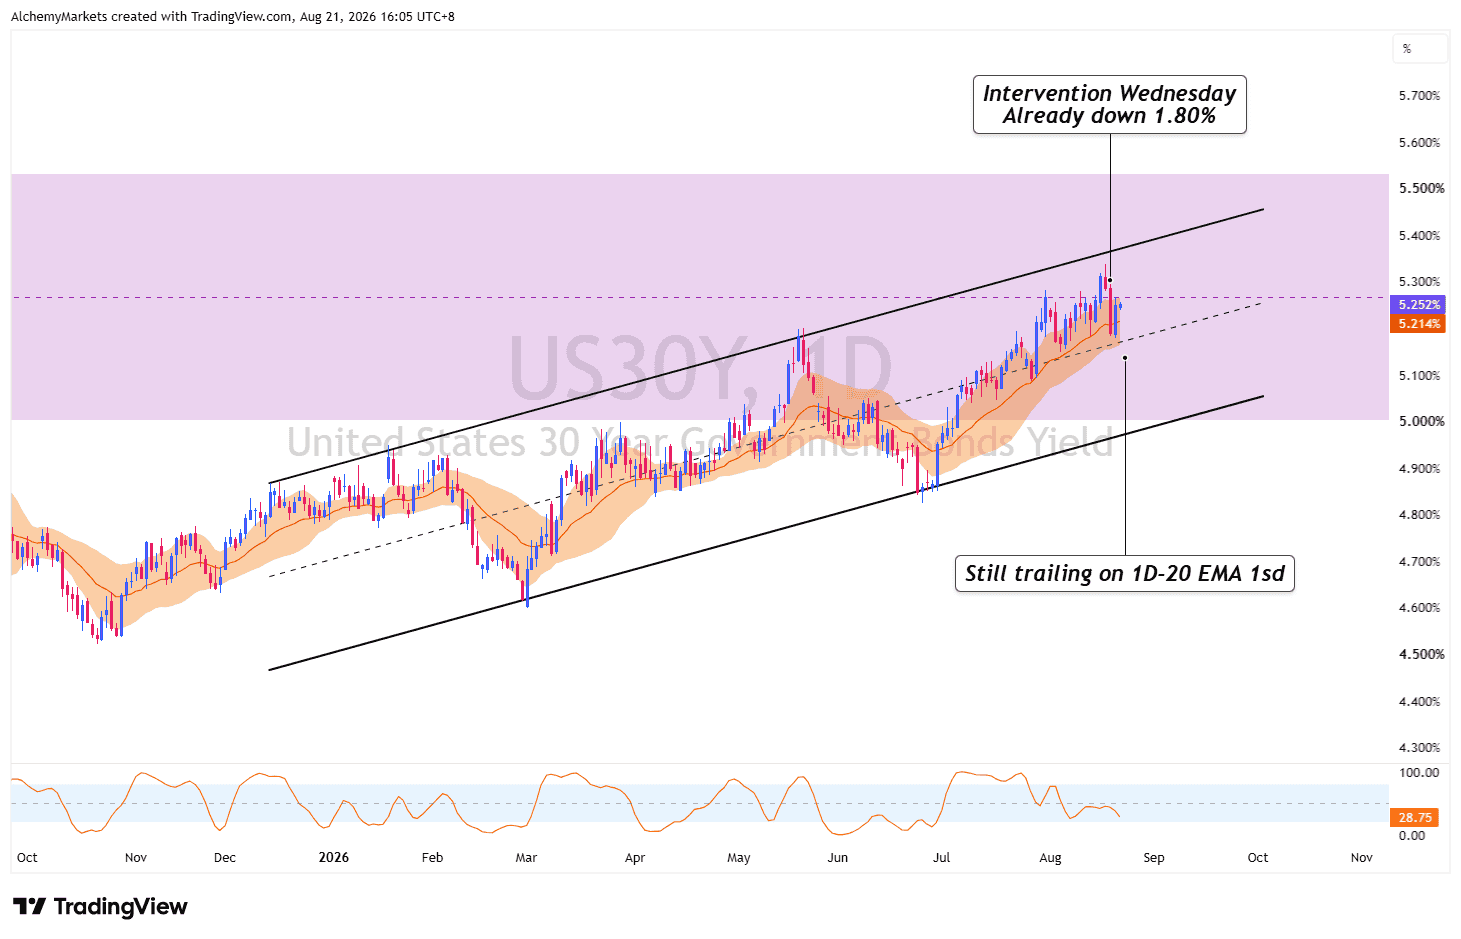
Yields initially fell, but much of that move was quickly recovered. The 30-year dropped sharply on Wednesday, then bounced back on Thursday and is still grinding around its rising 20-day EMA band.
For context, the 30Y yield was 5.30% during the intervention. Now it’s back at 5.248%.
The 10-year is telling a similar story. The 20-day EMA band is still acting as trend support, with roughly 4.60% as the lower shelf and 4.75–4.80% as the important area above.
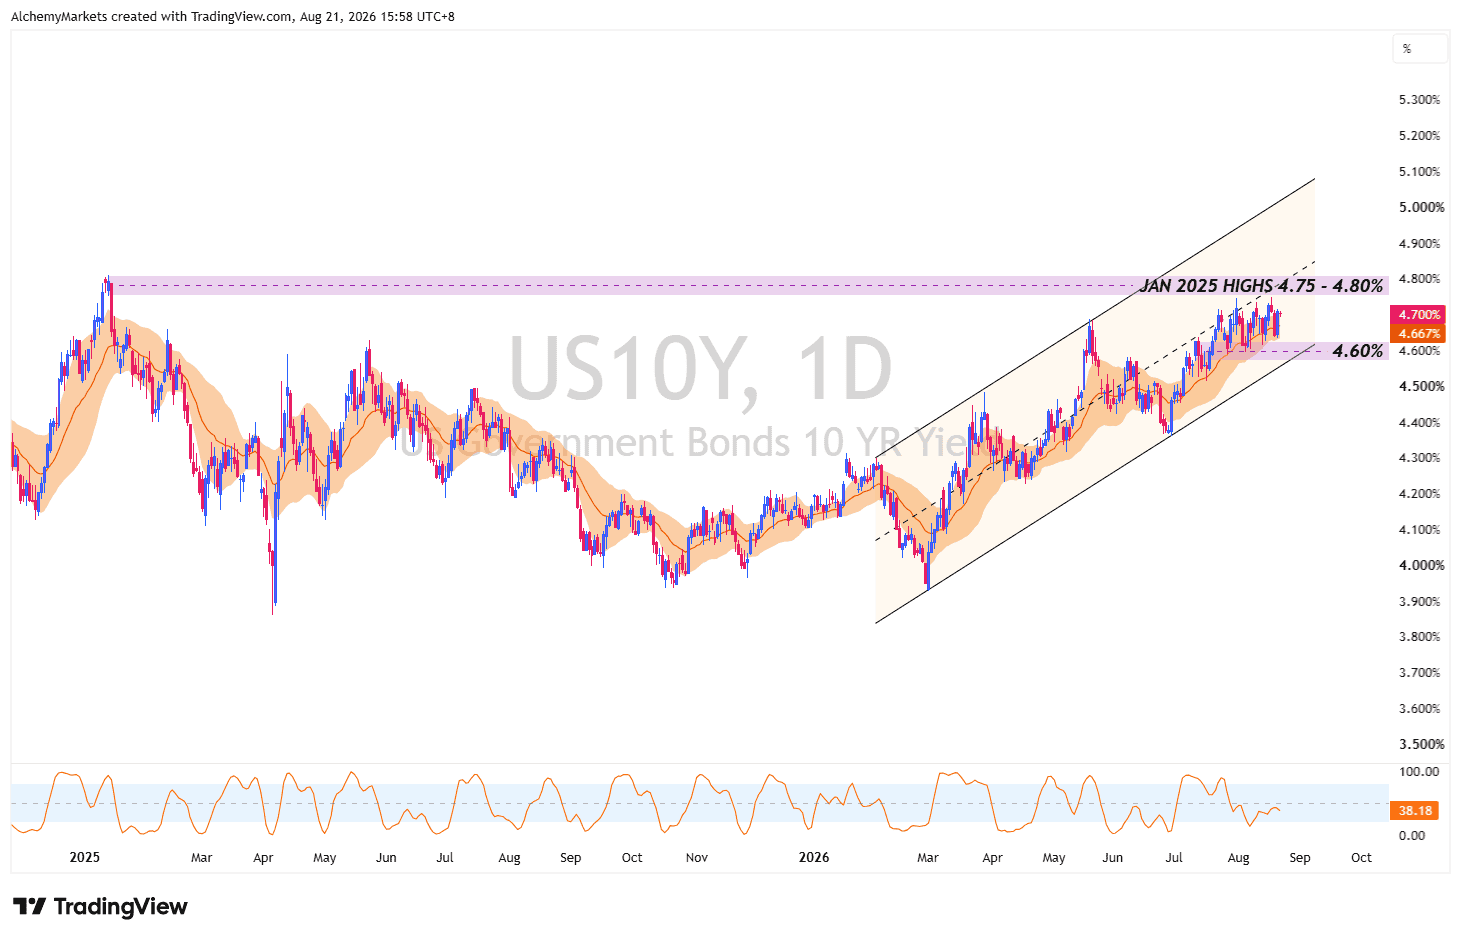
That means Treasury has changed the reaction, but not yet the underlying trend.
There is one important nuance for gold. If Treasury buying pulls the 30-year yield down faster than the 2-year, the 2Y–30Y spread will rise mechanically. That is a warning that the relationship we are tracking is changing, but it is not automatically bearish for gold.
The driver matters. A spread reversal led by a rising 2-year would be much more negative because it points to renewed Fed tightening pressure, higher short real yields and typically a firmer dollar. A reversal caused mainly by the 30-year falling can still leave gold supported through lower long-term yields.
So the cleaner invalidation is not simply a higher spread. It is the spread reclaiming its EMA band while the 2-year and dollar are also strengthening.
Gold and Silver still have the trend
Gold remains above its own daily 20-EMA band and is testing the 4,513–4,586 high-volume node area. Above that sits the larger 4,638–4,773 zone.
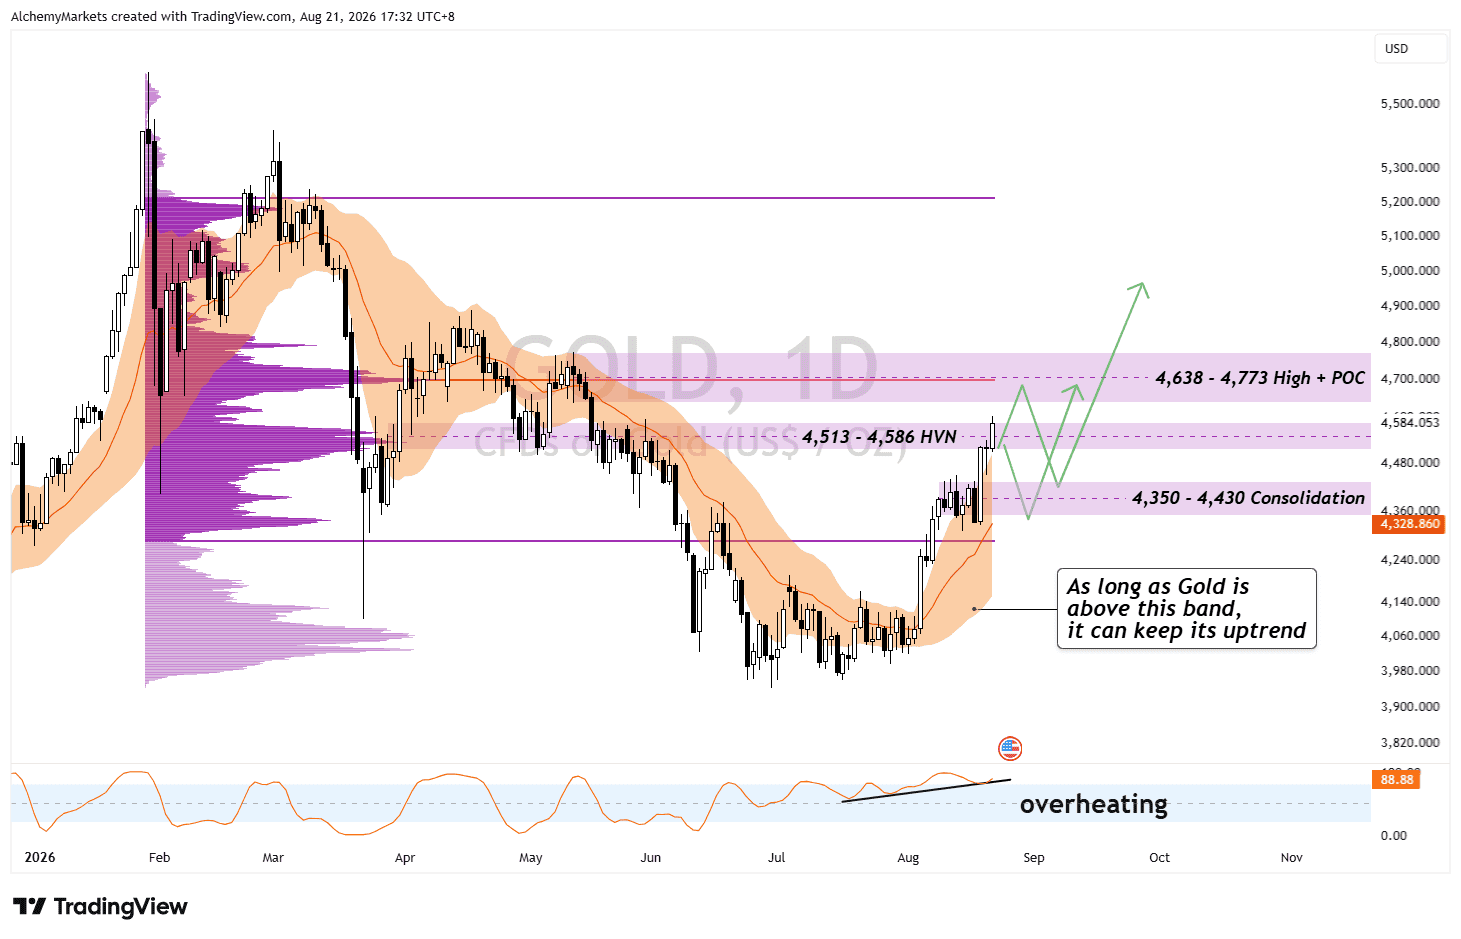
Momentum is overbought, so a pullback would not be surprising. The trend weakens more meaningfully if gold loses its EMA band, which would bring 4,350–4,430 back into focus.
Silver is following almost the same setup, testing 69–71.20 with 74.49–77.00 above. The first major pullback area sits around 65.75–66.30.
The Dollar is still helping
DXY has broken lower towards 98.6, adding another tailwind for precious metals. Momentum is stretched, so a short-term dollar rebound remains possible.
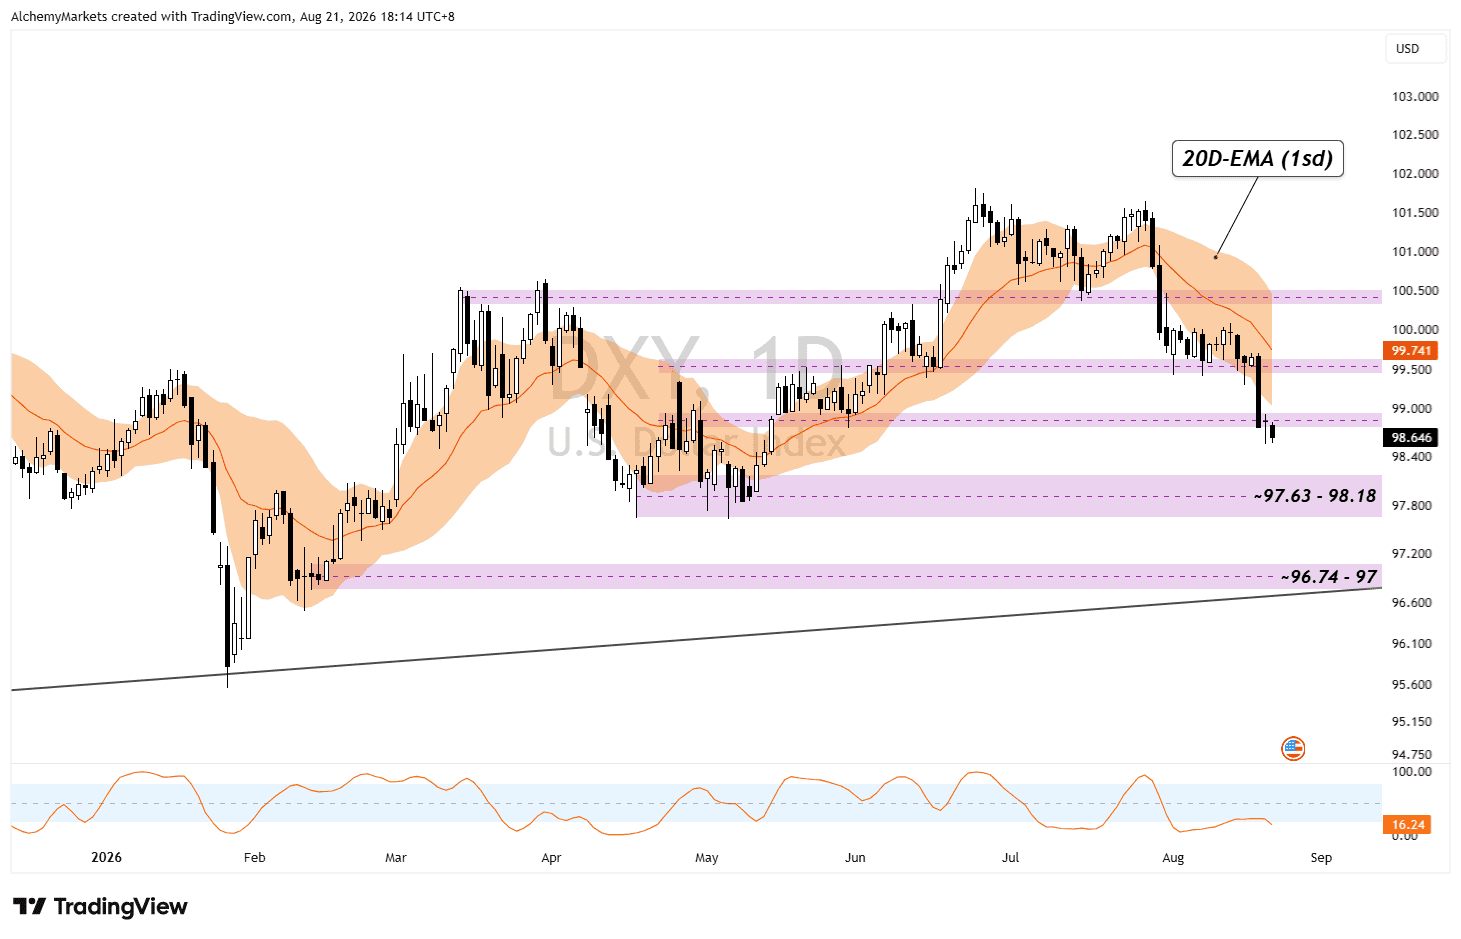
For now, the original thesis remains valid: the spread is below its trend band, gold and silver remain above theirs, and the dollar is weak. The clearest warning would be a spread reversal led by the 2-year, alongside a recovering dollar.
Author

Zorrays Junaid
Alchemy Markets
Zorrays Junaid has extensive combined experience in the financial markets as a portfolio manager and trading coach. More recently, he is an Analyst with Alchemy Markets, and has contributed to DailyFX and Elliott Wave Forecast in the past.
















