Can kicking is supportive to both stocks and bonds

Never underestimate the power of March. If you are an equity market bull, it is highly encouraging to see March seasonality kick in despite a global banking crisis. We generally see a mid-month bottom in March, and bank failure or not, that seems to be playing out again in 2023. For reasons we have been unable to pinpoint, the month of March has been fraught with volatility, chaos, panic....and historic bottoms.
As someone who makes a living in the leveraged brokerage industry, I can honestly say March is home to some of my most challenging career obstacles. It is the one time of year we know can make or break our business. A slip-up in risk management can wipe out months or years of work, and if severe enough, it can force a career change. In other words, March has been known for identifying those who are swimming naked. Unfortunately, SVB and others learned this lesson the hard way.
In March of 2020, we saw the Covid shutdown fallout, which ruined the lives of many traders and brokers. It came with a $ 14.00 weekend gap lower in crude oil and what can be categorized as a stock market crash. Although it was less talked about, the Treasury market rallied at an unprecedented pace leading those who were short the market to sustain incredible losses or at least ride them out. It took some time for the commodity markets to work things out, but as scary as March 2020 was, it was also the springboard for a 2-year rally.
In March of 2022, it was the Russian invasion of Ukraine that triggered multiple consecutive limit-up days in wheat, and a $40.00 dollar run in oil in a matter of days. This particular catastrophe didn't end in March of 2022, but we did see sharp price reversals that, at minimum, staved off a larger panic. That said, the price moves that began in March of 2022 on news of war mostly unwound themselves with time.
In March of 2016, there was a commodity depression. Oil fell under $30.00, natural gas was near $1.50, corn was under $3.50, and beans were under $8.00. Deflation, not inflation, was the driver; the stock market was dragged down with it. Yet, March was the turnaround month. Both commodities and stocks began substantial rallies after the last person sold. Sometimes that is what it takes to turn a trend; it is as simple as running out of sellers.
In summary, March volatility has historically proven to be opportunities. The stock market, specifically, tends to find a March low on or around the middle of the month. Few expected this month to conform to seasonality due to bank failures, but it did. In our view, this is a sign that the bad news is out and, seemingly, can't get worse. If that is the case, the news doesn't have to get better for the stock market to recover...we simply need to avoid any further surprises. After all, if the majority of market participants have already reacted to the bad news (sold stocks or even gone short), there might not be enough sellers to keep prices under pressure. We see the same price action in Treasuries; the world was bearish on the long end of the curve coming into the month but record net short positions have started to unwind themselves. The month of March has become an inflection point and a place where short-term trends come to die.
Treasury Futures Markets
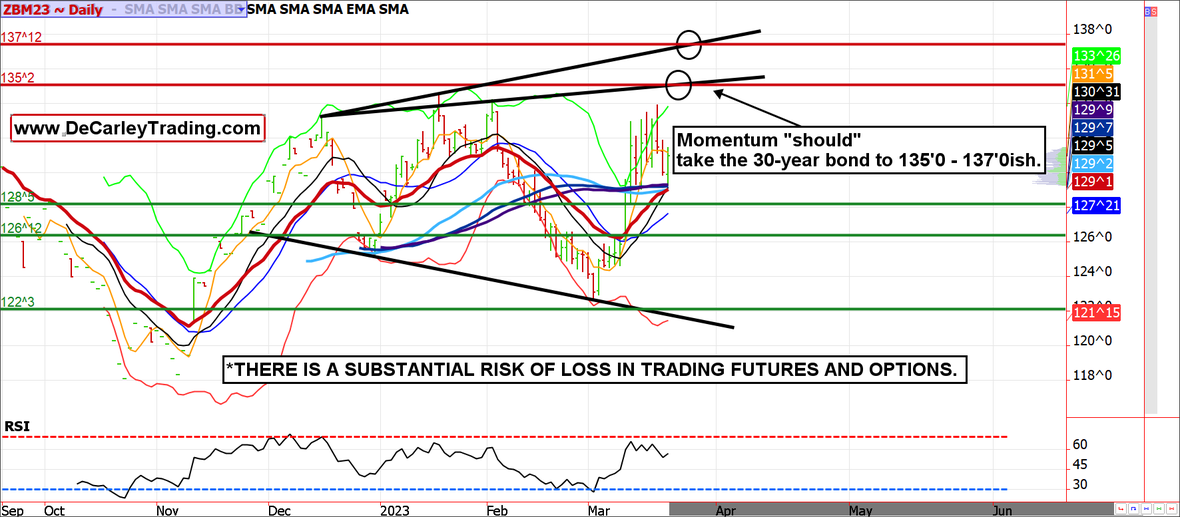
30-year Treasury Bond Futures
The Fed raises rates but market rates when down!
Jerome Powell continues to focus on a 2% inflation rate suggesting more rate hikes to come, but the market isn't "buying" it. Instead, they are buying Treasuries! The Fed, and particularly Chairman Powell, doesn't have an easy job. But there is room for criticism; had they not been so keenly focused on keeping rates accommodative from 2020 to 2021 to reach their target unemployment rate, we might not be in this mess. Maybe 4% is the new 2%? There is no need to continue pressing while things are breaking...in my humble opinion.
In any case, the US dollar is back under pressure and as long as this is the case...the "everything" rally is in the works. Can we see 135ish in the long bond?
Treasury futures market consensus:
The June 30-year bond "should" see 135'0 to 137'0 on this run.
Technical Support: 128'05, 126'12, and 122'03 ZN: 112'13,110'27 and 109'26
Technical Resistance: ZB: 135'02 and 136'29 ZN: 115'07 and 117'02
Stock Index Futures
Comments from a previous newsletter but still in play - Stocks can go up when news is bad
Sometimes it is hard to fathom how stocks can move higher in the face of a dismal fundamental backdrop, but it happens all of the time. The most glaring example of this was in March of 2020; most of the country (and even the world) was shuttered but the equity indices turned on a dime and rallied for almost two years. If markets can go up with the economy shut down, they can go up with a handful of bank failures. Banks, and markets, live and die by the actions of humans....and humans rarely behave in a logical manner. They are complacent when they should be fearful, and fearful when they should be confident. In other words, they are often on the wrong foot in the markets.
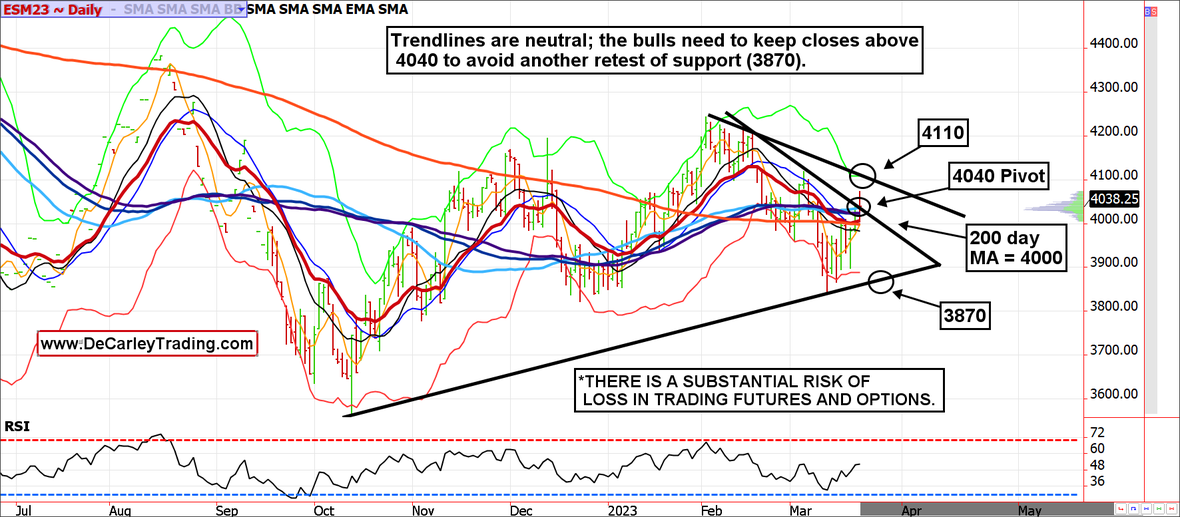
Perhaps the market gets another spook, but there are some things working in favor of the bulls. This week is the quadruple witch (futures and options are expiring); this often has an upward bias. The weekly pivot price of 3850ish, appears to be holding (a close this week above that level will solidify strength). The month of March generally ends with strength and has been the source of multiple "bottoms". And "the world" is short the market and bearish (contrarian indicator).
Stock index futures market consensus:
Today's close below 4040 gives the bears an edge but 4000 is the 200-day moving average, which will be pivotal.
Technical Support: 4000, 3870, 3790, 3600
Technical Resistance: 4040, 4110, 4270
E-mini S&P Futures Swing/Day Trading Levels
These are counter-trend entry ideas. The more distant the level, the more reliable, but the less likely it is to get filled
ES Day Trade Sell Levels: 4040, 4110, 4270
ES Day Trade Buy Levels: 3935, 3850, 3790
In other commodity futures and options markets...
October 28 - Buy May soybean meal 410 call.
November 4 - Buy February $85/$80 crude oil put spread and sell the $103 call for a credit of about $1,000.
November 11 - Buy January sugar 19.50 put for about 40 ticks.
November 16 - Buy May coffee 170/200 call spread and sell a naked 140 put to finance the trade.
November 21 - Buy March cocoa 2600 call near 70 points ($700).
December 2 - Buy May wheat $8.00 call, sell the $9.00 call and sell the $7.00 put for a net cost of about 5 cents ($250).
December 23 - Buy March sugar 20.75 put for about 70 points ($784).
December 23 - Sell April nat gas $3.50 put.
January 10 - Sell March e-mini S&P 500 strangles using the 4150 call and the 3550 put.
January 10 - Buy May corn $7.00 calls near 13 cents.
February 16 - Buy March Live cattle 163 puts near 75 ticks.
February 21 - Buy May NG 2.50 call, sell 3.00 call and sell 2.00 put.
February 24 - Buy April week 3 4100 call, sell the 4200 call and then sell a 3775 put for a credit of 15.00.
February 27 - Buy June bond 127 call, sell the 130 call, and sell the 120 put for a credit of about 24 ticks.
February 28 - Buy May sugar 20.00 put near 65
March 1 - Buy May wheat 7.25 call, sell 7.75 call and sell the 6.75 put for a credit of about 5.5 cents.
March 7 - Buy July soybean meal 450 put near 8.25.
March 10 - Buy July corn $6.50 call near 13.5 cents.
March 13 - Buy June cattle 153 puts near 2.40.
March 20 - Buy August crude oil $70 call, sell the $80 call, and the $55 put for a small credit.
March 20 - collar strategy in December cotton. Go long the December future near 79.00, buy the December 70.00 put and sell the 90.00 call for a small credit (limited risk and limited reward).
March 22 - Risk reversal in Christmas hogs - Buy the December 90.00 call and sell the 66.00 put for a net credit of 70 to 100 points.
Due to time constraints and our fiduciary duty to put clients first, the charts provided in this newsletter may not reflect the current session data.
Seasonality is already factored into current prices, any references to such does not indicate future market action.
Author

Carley Garner
DeCarley Trading
Carley Garner is an experienced commodity broker with DeCarley Trading, a division of Zaner, in Las Vegas, Nevada. She is also the author of multiple books including, “Higher Probability Commodity Trading” and “A Trader's First Book on Commodities”.


