CAD/JPY: The bear sentiment drives the pair towards the South

CAD/JPY has been bearish for the last three days. The daily chart shows that the price gets caught within two horizontal levels. The price had a bounce at a double bottom level and headed towards the North. It then had a rejection at a double top level. Since then, the price has been heading towards the level of support again. The sellers on the daily chart may want to wait for the price to consolidate and get a bearish reversal candle to go short again. However, the H1 and the H4 chart look bearish, and they may offer short entry to the sellers.
Chart 1 CAD/JPY H1 Chart
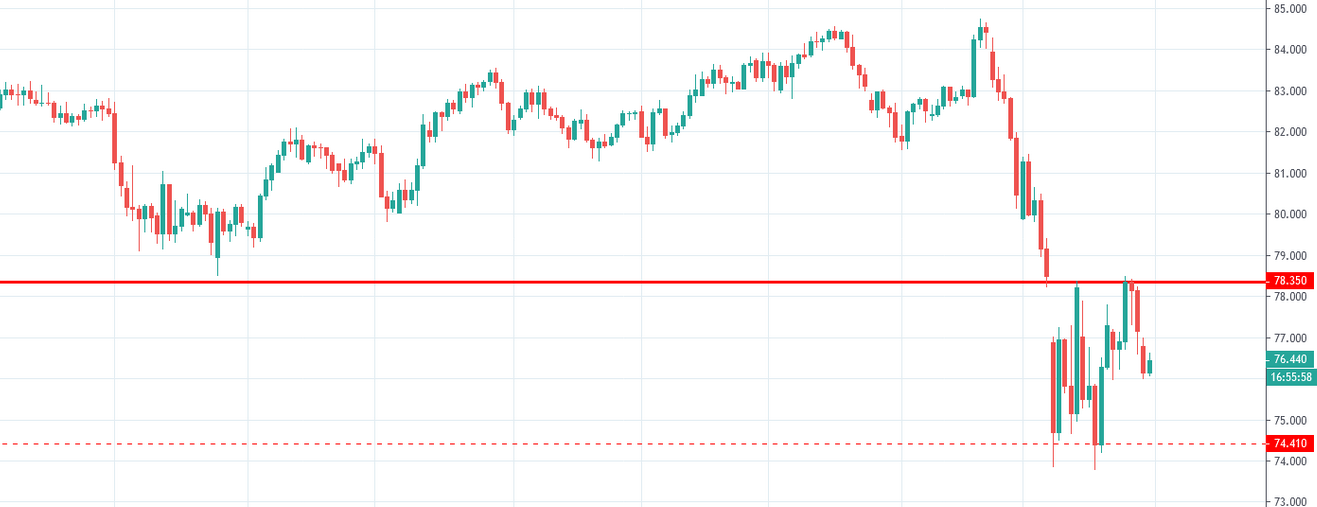
The chart shows that the price has been trapped within two levels. The level of 78.350 has been working as resistance and 74.410 as a level of support. The price upon having its rejection at the level of resistance has been heading towards the South. The sellers should wait for the price to consolidate and produce a bearish reversal candle to drive the price towards the 74.410 level.
Chart 2 CAD/JPY H4 Chart
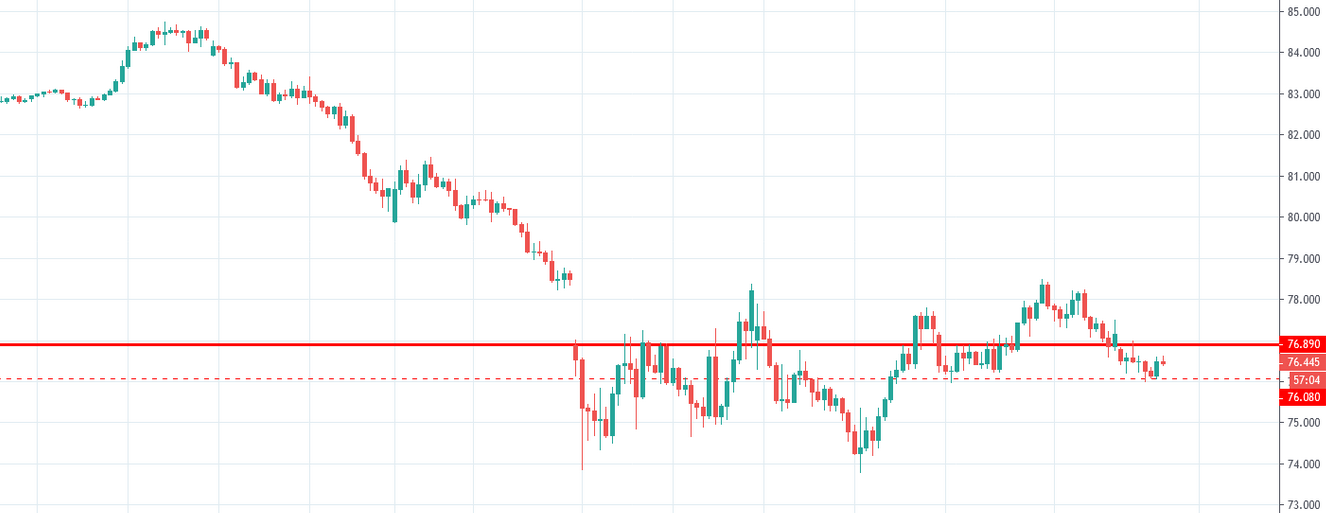
The H4 chart shows the price had a rejection at a double top resistance. It has been heading towards the South with good momentum. It has found its support at the level of 76.080 and produced a bullish engulfing candle. The price may go towards the North further to find its resistance. The level of 76.890 may work as the level of resistance. If it produces a bearish reversal candle, the sellers may go short below the level of 76.080. It may find its next support around the level of 74.500.
Chart 3 CAD/JPY H1 Chart
The chart shows that the price upon having a bounce at the level of 76.080 headed towards the level of 76.600. The level produced a bearish Marubozu candle. The sellers should keep their eyes on the pair to go short if it makes a breakout at the level of 76.080. The price may find its next support at around the level of 75.530. In case of a bullish breakout at the 76.600 level, the price may find its next resistance around the level of 76.890.
The daily and the H4 chart need time to get bearish. However, the H1 chart looks ready to get bearish. The H1 chart may make the pair have a bearish day today.
Author

EagleFX Team
EagleFX
EagleFX Team is an international group of market analysts with skills in fundamental and technical analysis, applying several methods to assess the state and likelihood of price movements on Forex, Commodities, Indices, Metals and


