CAD/JPY: looks suitable for the buyers, less liquidity is a factor
CAD/JPY has been on consolidation after being very bullish on the daily chart. The last day’s candle came out as a doji candle closing within a flipped support. If today’s candle comes out as a bullish engulfing candle, the price may head towards the North and makes a new higher high. Major intraday charts’ price action has been bullish as well. Thus, the buyers may control the pair for a few days come.
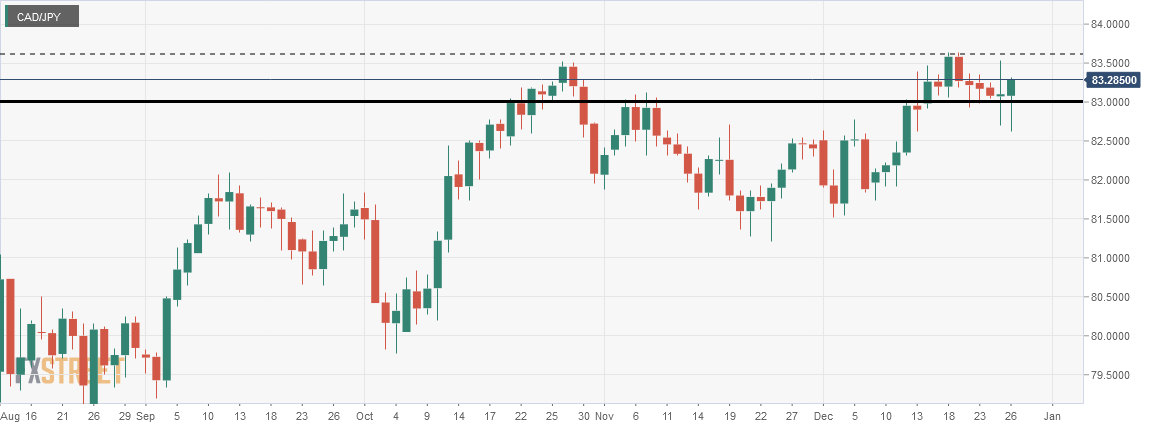
The chart shows that the price has been consolidating around the level of support at 83.0000. It reacted to the same level earlier. Thus, the buyers must have been keeping an eye at the level. As per buyers’ expectations, the level holds the price and produces a bullish reversal candle. Since it is a doji candle, the daily buyers may want to wait to get a stronger bullish signal, such as a bullish engulfing candle, to go long on the pair. However, the intraday traders may get themselves engaged in buying the pair upon breakout. Let us now have a look at the two major intraday charts.
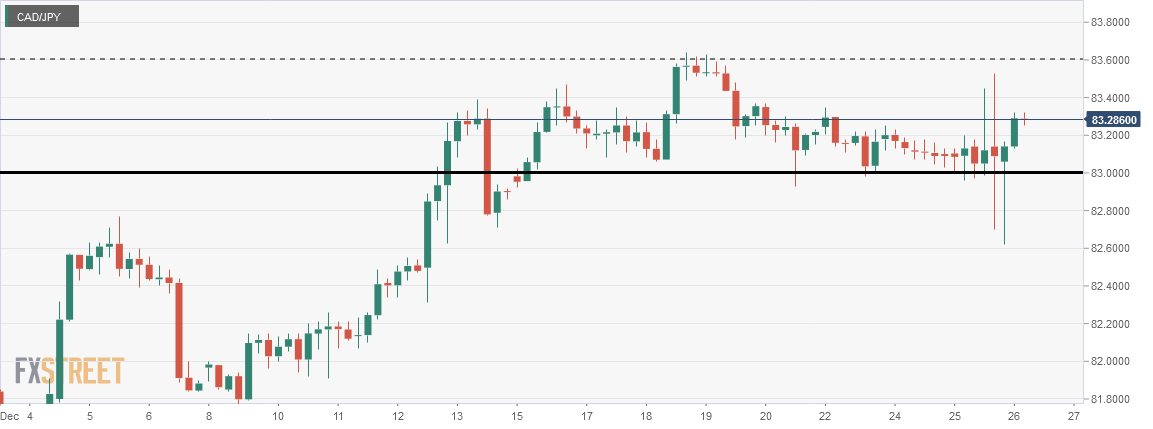
The H4 chart shows that the price has been on consolidating around the level of support strongly. It had several bounces already but did not produce any significant bullish momentum. As of writing, the last two H4 candles came out as strong bullish candles. The first one came out as a bullish pin bar followed by another bullish candle. The price may find its next resistance at the level of 83.6000 as far as the H4 chart is concerned. This offers the buyers to have a lucrative risk-reward. Let us now find out how the H1 chart looks.
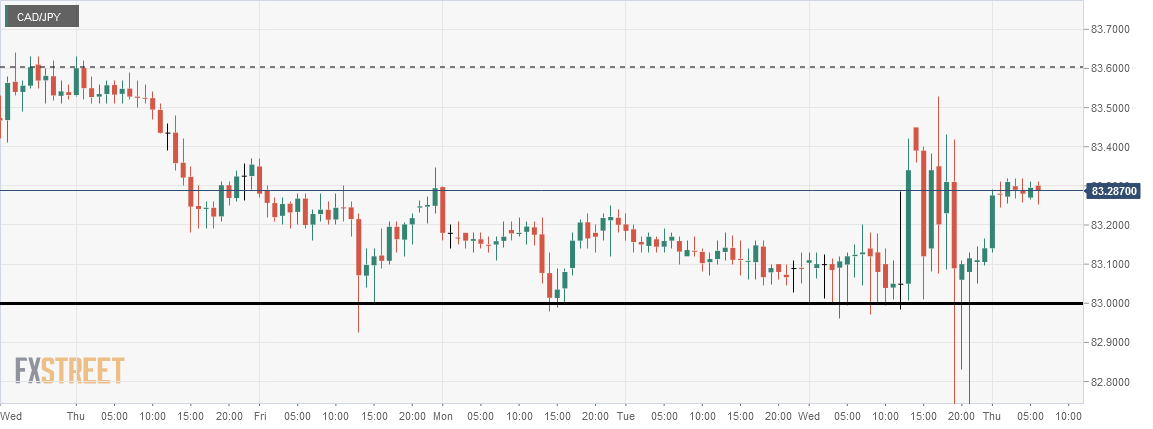
The chart shows that the price may find its resistance at the level of 83.4500. However, the price has been on consolidation around the support level of 83.2640, and the resistance is at the level of 83.3214. If the price makes a breakout at the resistance, the buyers may want to go long on the pair up to the level of 83.4500. Since the H4 and the daily chart favor the buyers, the H1 buyers may take partial profit around the H1 resistance and let the rest of the trade run to grab more pips.sup
These three charts look good for the buyers. However, this is the last week of the year 2019. The market may not be that vibrant as it usually does. The H4 and the daily chart may not make a breakout at the resistance, but the H1 chart may make a breakout and head towards the North.
Author

EagleFX Team
EagleFX
EagleFX Team is an international group of market analysts with skills in fundamental and technical analysis, applying several methods to assess the state and likelihood of price movements on Forex, Commodities, Indices, Metals and


