|

Buying Elliott Wave Dips In 10 Year T-Note Futures

In this technical blog, we are going to take a look at the past performance of 10 Year T-Note Futures ticker symbol: $ZN_F 1-Hour Elliott wave Charts that we presented to our members. In which, the rally from October 2018 low showed a higher high sequence in an impulse structure with the right side up called for more upside to take place. Therefore, our members knew that buying the dips into the direction of the right side tag remained the preferred path. We will explain the Elliott wave structure & buying opportunity our members took below:

$ZN_F 10 Year T-Note Futures 1 Hour Elliott Wave Chart

ZN

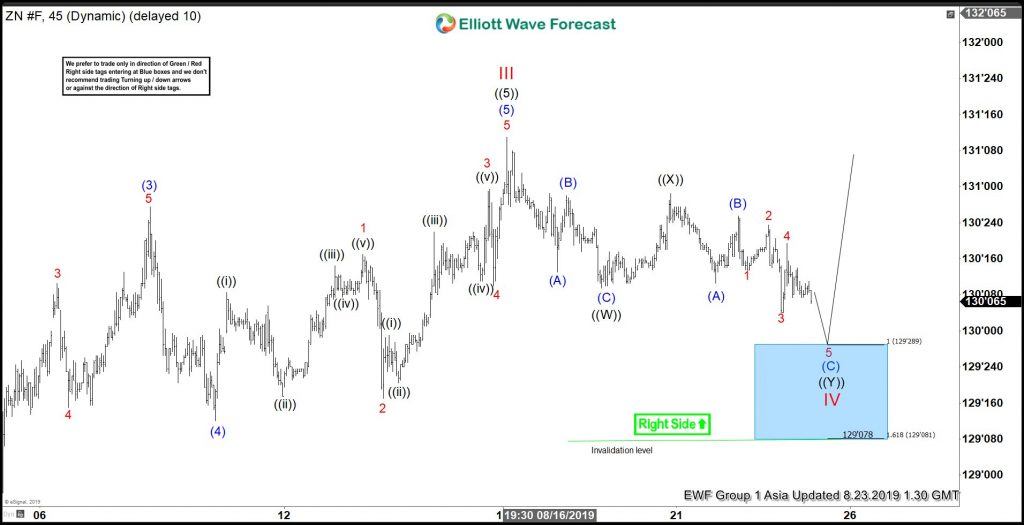
Above is the 1 Hour Elliott Wave Chart from 8/23 Asia update, in which the pair ended the cycle degree wave III at $131.11 high. Down from there, the pair made a cycle degree wave IV pullback. The internals of that pullback unfolded as double three structure where wave ((W)) ended as lesser degree zigzag structure at $130.09 low. Up from there, wave ((X)) bounce ended at $130.30 high. Wave ((Y)) unfolded as another lesser degree zigzag structure where wave (A) ended at $130.10 low. Wave (B) bounce ended at $130.25 high and wave (C) was expected to reach towards blue box at $129.28-$129.08 100%-161.8% Fibonacci extension area of ((W))-((X)). Then from there, pair was expected to provide buying opportunity to our members into the direction of right side tag looking for new highs or for minimum 3 wave reaction higher at least.

$ZN_F 10 Year T-Note Futures 1 Hour Elliott Wave Chart

ZN

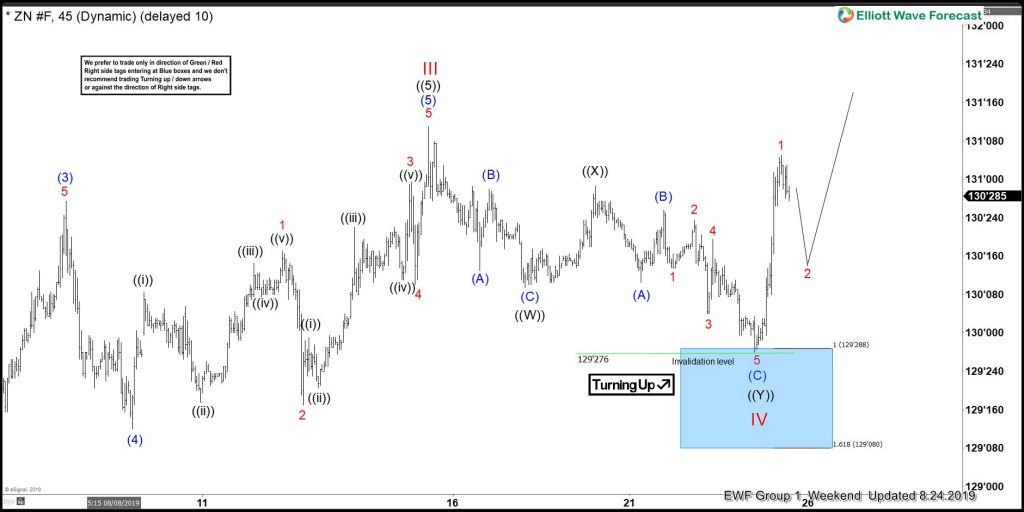
$ZN_F 10 Year T-Note Futures 1 Hour Elliott Wave Chart from 8/24 Weekend update, in which instrument managed to reach blue box at $129.28-$129.08 area and rallied higher. Allowed our members to create risk-free position shortly after taking the position at the blue box area.

Author

Elliott Wave Forecast Team

Elliott Wave Forecast Team

ElliottWave-Forecast.com

More from Elliott Wave Forecast Team
Share:

Editor's Picks

EUR/USD flat lines below 1.1900; divergent Fed-ECB expectations offer support

The EUR/USD pair struggles to capitalize on the overnight bounce from the 1.1835-1.1830 region and oscillates in a narrow band during the Asian session on Thursday. Spot prices currently trade around the 1.1875 area, remaining nearly unchanged for the day and staying within striking distance of an over one-week high, reached on Tuesday, amid mixed cues.

GBP/USD slips heading into the Thursday trading window

The Pound Sterling pulled back from four-year highs on Wednesday, weighed down by a combination of Bank of England dovishness and UK political uncertainty, even as the US Dollar weakened on soft labor market revisions. 

Gold posts modest gains above $5,050 as US-Iran tensions persist despite strong labor data

Gold price trades in positive territory near $5,060 during the early Asian session on Thursday. The precious metal edges higher despite stronger-than-expected US employment data. The release of the US Consumer Price Index inflation report will take center stage later on Friday. 

Bitcoin holds steady despite strong US labour market

Bitcoin briefly bounced from $66,000 to above $68,000 but slightly reversed those gains following Wednesday's US January jobs report. The top crypto is hovering around $67,000, down 2% over the past 24 hours as of writing on Wednesday.

The market trades the path not the past

The payroll number did not just beat. It reset the tone. 130,000 vs. 65,000 expected, with a 35,000 whisper. 79 of 80 economists leaning the wrong way. Unemployment and underemployment are edging lower. For all the statistical fog around birth-death adjustments and seasonal quirks, the core message was unmistakable. The labour market is not cracking.

XRP sell-off deepens amid weak retail interest, risk-off sentiment

Ripple (XRP) is edging lower around $1.36 at the time of writing on Wednesday, weighed down by low retail interest and macroeconomic uncertainty, which is accelerating risk-off sentiment.