Buy the sizzle, sell the news

USD: Dec '24 is Up at 101.680.
Energies: Nov '24 Crude is Up at 71.72.
Financials: The Dec '24 30 Year T-Bond is Down 11 ticks and trading at 123.30
Indices: The Dec '24 S&P 500 emini ES contract is 56 ticks Lower and trading at 5747.00.
Gold: The Dec'24 Gold contract is trading Down at 2665.40.
Initial conclusion
This is not a correlated market. The USD is Up and Crude is Up which is not normal, but the 30 Year T-Bond is trading Lower. The Financials should always correlate with the US dollar such that if the dollar is Higher, then the bonds should follow and vice-versa. The S&P is Lower and Crude is trading Higher which is not correlated. Gold is trading Lower which is correlated with the US dollar trading Up. I tend to believe that Gold has an inverse relationship with the US Dollar as when the US Dollar is down, Gold tends to rise in value and vice-versa. Think of it as a seesaw, when one is up the other should be down. I point this out to you to make you aware that when we don't have a correlated market, it means something is wrong. As traders you need to be aware of this and proceed with your eyes wide open. Asia traded mainly Higher with the exception of the Shanghai and Nikkei exchanges. Europe is trading Lower with the exception of the London and Spanish Ibex exchanges.
Possible challenges to traders
-
Challenger Job Cuts are out at 7:30 AM EST. This is Major.
-
Unemployment Claims are out at 8:30 AM EST. This is Major.
-
Final Services PMI is out at 9:45 AM EST. This is Major.
-
ISM Services PMI is out at 10 AM EST. This is Major.
-
Factory Orders are out at 10 AM EST. This is Major.
-
FOMC Member Schmid Speaks at 10 AM EST. This is Major.
-
Natural Gas Storage is out at 10:30 AM EST. This is Major.
-
FOMC Member Bostic Speaks at 10:40 AM EST. This is Major.
Traders, please note that we've changed the Bond instrument from the 10 year (ZN) to the 2 year (ZT). They work exactly the same.
We've elected to switch gears a bit and show correlation between the 2-year Treasury notes (ZT) and the S&P futures contract. The YM contract is the Dow Jones Industrial Average, and the purpose is to show reverse correlation between the two instruments. Remember it's likened to a seesaw, when up goes up the other should go down and vice versa.
Yesterday the ZT migrated Higher at around 8:30 AM EST with no real economic news in sight and began its Downward slide. Look at the charts below and you'll see a pattern for both assets. The Dow moved Higher at 8:30 AM and the ZT moved Lower at around the same time. These charts represent the newest version of Bar Charts, and I've changed the timeframe to a 15-minute chart to display better. This represented a Short opportunity on the 2-year note, as a trader you could have netted about 20 ticks per contract on this trade. Each tick is worth $7.625. Please note: the front month for ZT is Dec and the Dow is now Dec '24. I've changed the format to filled Candlesticks (not hollow) such that it may be more apparent and visible.
Charts courtesy of barcharts
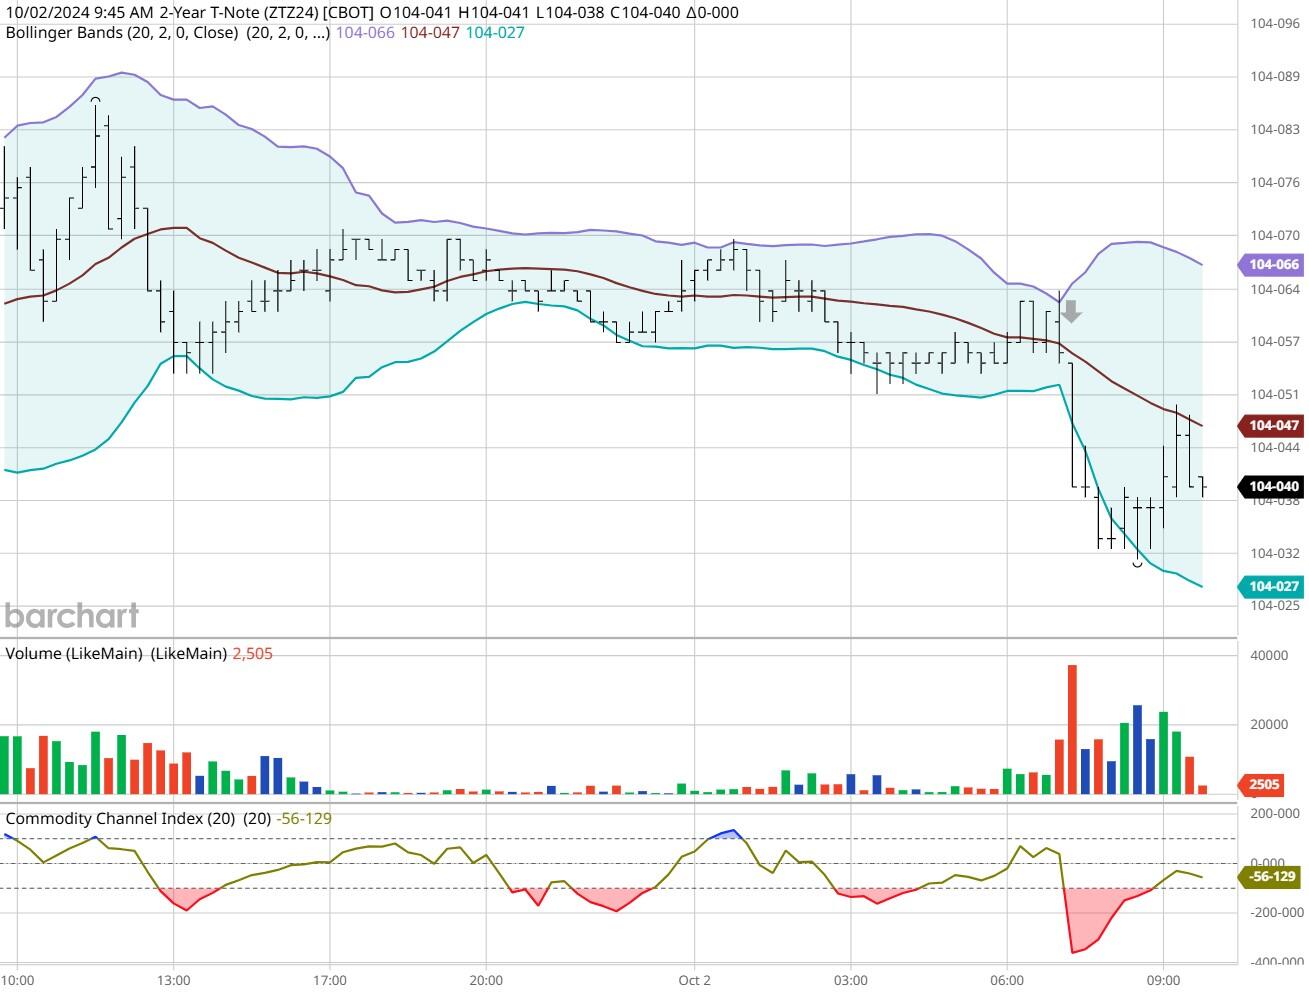
ZT -Dec 2024 - 10/02/24
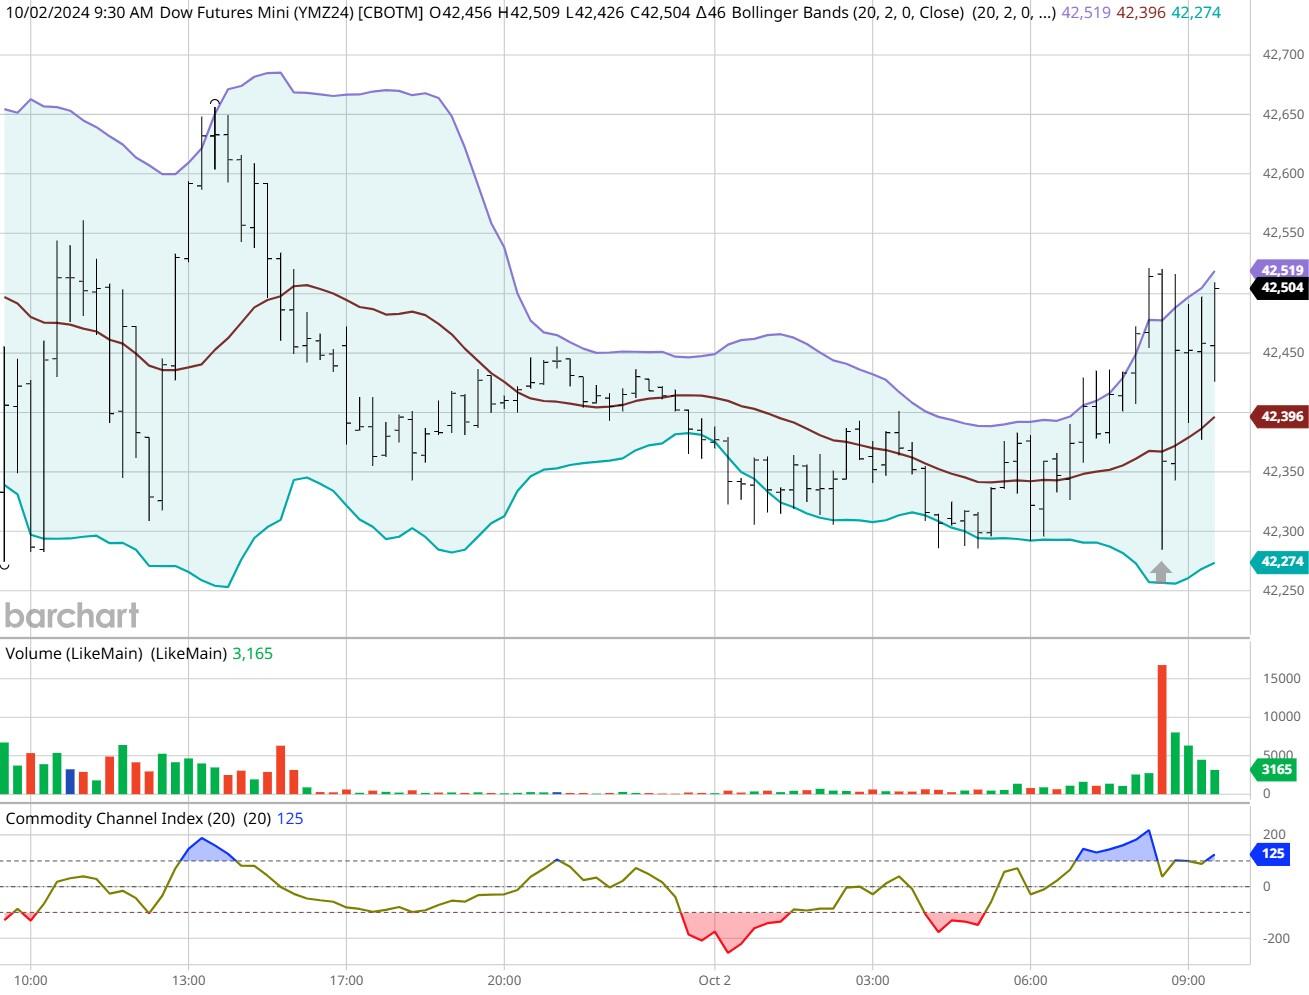
Dow - Dec 2024- 10/02/24
Bias
Yesterday we gave the markets a Downside bias however the markets had other ideas. The Dow rose by 40 points and the other indices rose slightly as well. Today we aren't dealing with a correlated market and our bias is Neutral or Mixed.
Could this change? Of Course. Remember anything can happen in a volatile market.
Commentary
There used to be a saying on Wall Street: buy the sizzle, sell the news. So, what was the sizzle? The sizzle was Iran launching missiles into Israel on Monday, but now that it has occurred the market rebounded slightly. The instrument we're talking about is the bonds. So, you would buy the bonds on the presumption that the markets would be disrupted by a war event and then sell them when the market stabilizes. We did not use this logic but rather saw the USD and Bonds Higher Wednesday morning. Today we have Challenger Job Cuts and Factory Orders.
Author

Nick Mastrandrea
Market Tea Leaves
Nick Mastrandrea over 20 years experience in trading and formerly held a NASD Series 7. He currently holds a NJ Life, Health and Variable Authority. Nick is a published writer and his work has appeared in Futures Magazine, TraderPlanet and others.


