Bulls push back, bears defend the gates - These levels decide what comes next

The new week starts with several markets sitting right at technically important decision points.
The Dollar is pushing into fresh highs, while metals are trying to defend key support zones and turn last week’s weakness into a counterattack. We’re also seeing the first buy signals and positive divergences appear in a few places but most of them still need confirmation. So, this week is less about chasing the first move and more about watching which side can actually hold the levels that matter.
Dollar (DX.F)
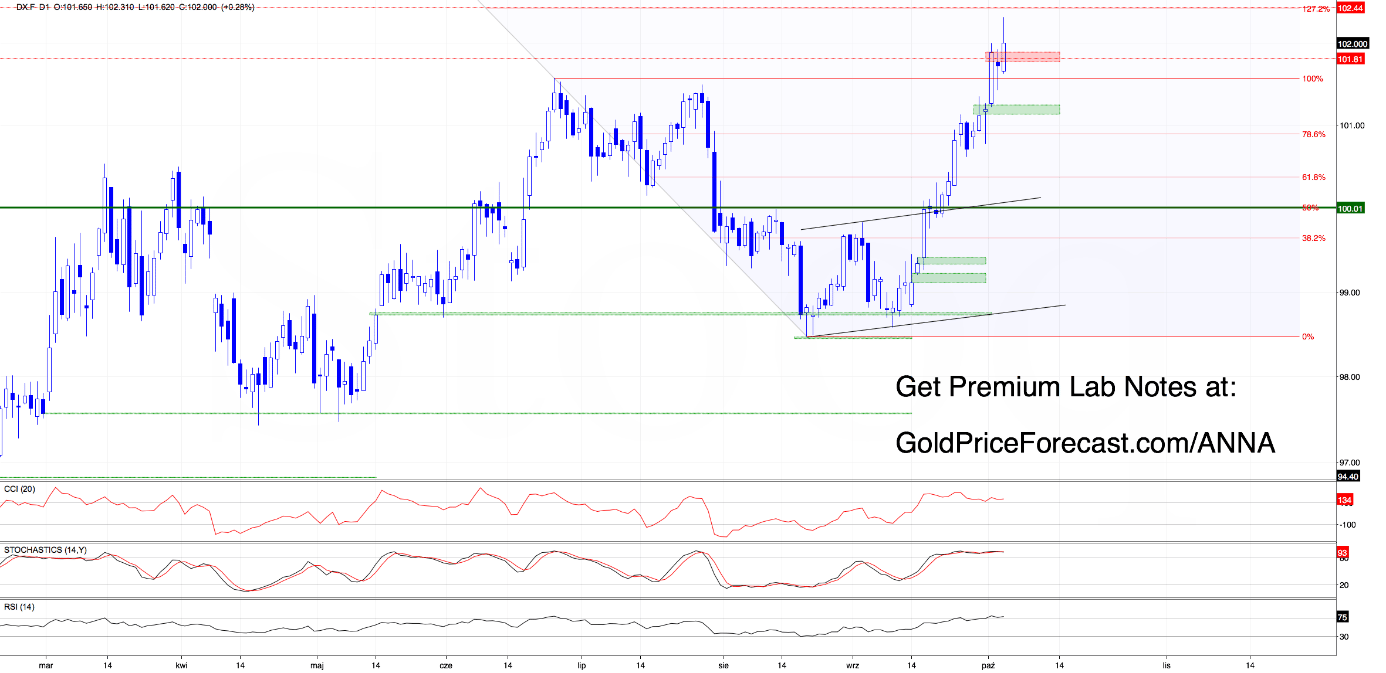
The first thing that jumps out on the chart is the breakout above last week’s high and today’s formation of a fresh local high.
There is another detail worth watching: if the bulls manage to close the day above 101.88, they will also close Friday’s bearish gap.
So, what comes next?
The road north toward the upside targets we discussed last week remains open.
As a reminder:
“(...) The next upside target would be the strong supply zone at 102.36–102.44, based on the 38.2% Fibonacci retracement of the 2022–2026 downward move (...), together with the 127.2% Fibonacci extension visible on the daily chart.(...)”.
Zooming Out
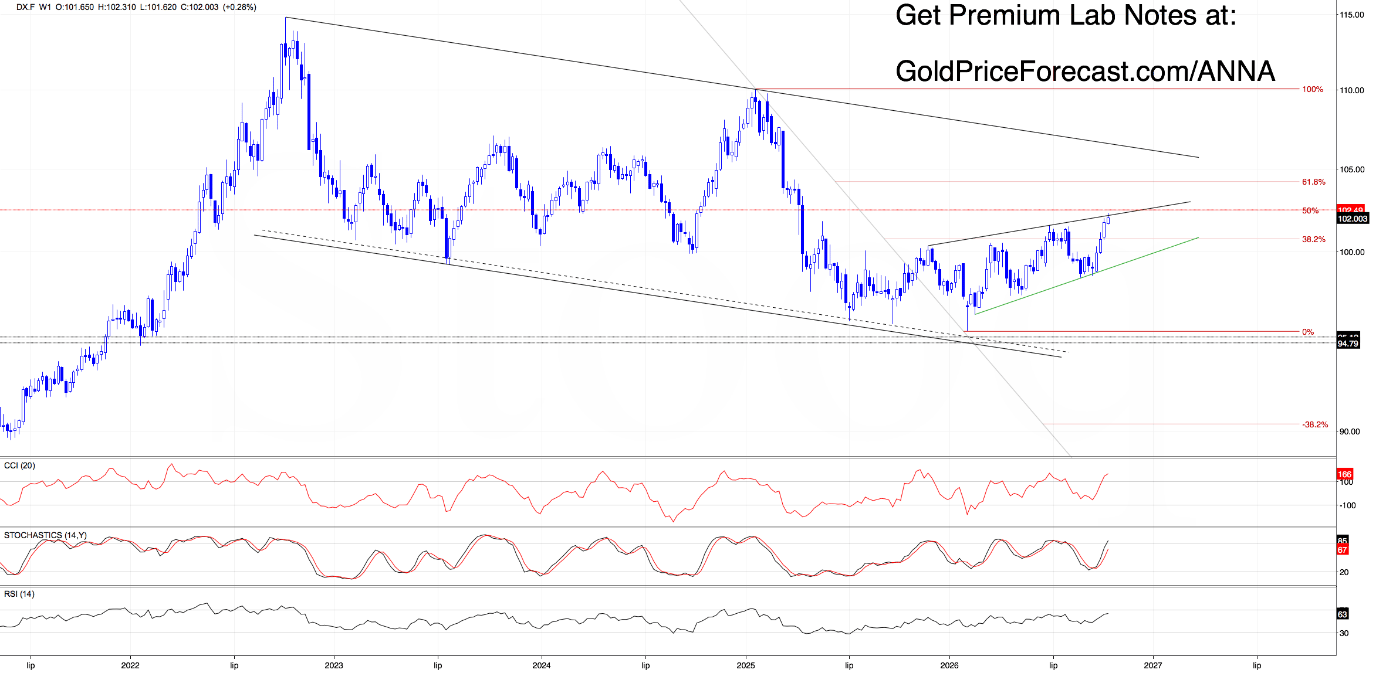
Before moving on to Gold, there is one more thing worth highlighting on the weekly chart.
The Dollar is approaching an important resistance combination: the upper boundary of the multi-week rising wedge together with the 50% Fibonacci retracement of the decline between January 2025 and February 2026.
That strengthens the resistance area we discussed last week and suggests that at least a short-term correction of the latest rally may be just around the corner.
What would ruin the bears’ plans and invalidate that scenario? A daily close above 102.50.
Daily Takeaway: Watch 101.88 first. A daily close above it would close Friday’s bearish gap and keep the upside path open toward 102.36-102.44. At the same time, the weekly resistance zone is getting stronger, so a short-term correction remains possible unless the bulls manage to close above 102.50.
Silver (SI.F)
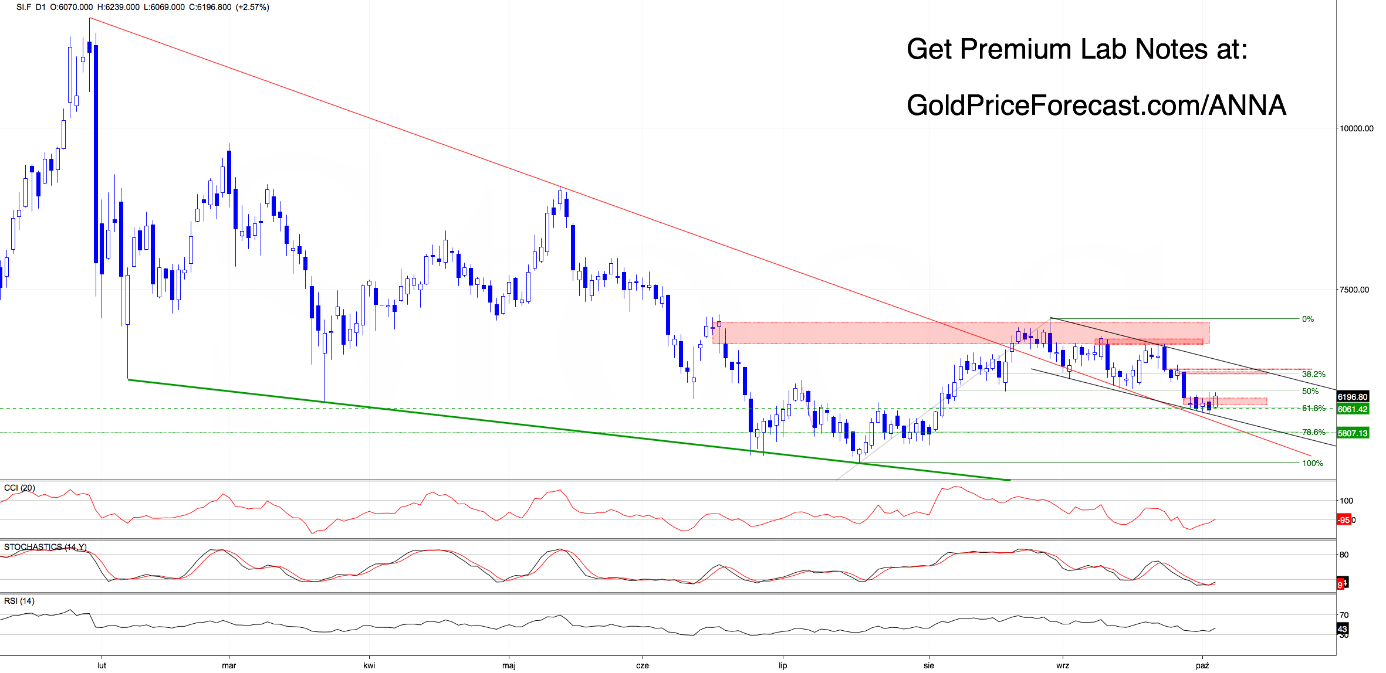
Despite Friday’s failed attempt to push through last Tuesday’s bearish gap at 6103-6171, the lower boundary of the black declining channel continues to keep sellers in check.
There is another interesting detail.
Even though Friday produced a bearish engulfing pattern, the successful defense of the lower channel boundary led to a higher opening during today’s Asian session. That created a fresh bullish gap at 6041-6070, which attracted buyers back into the market.
The result?
The bulls are now making good progress toward finally closing last week’s bearish gap and attacking the next resistance area around 6500 (including 6466-6480 gap).
There is one condition. They need to keep price above 6171 into the daily close.
The indicators are helping as well: CCI and Stochastics have generated preliminary buy signals, giving buyers another technical argument to fight for higher levels in the coming days.
Zooming Out
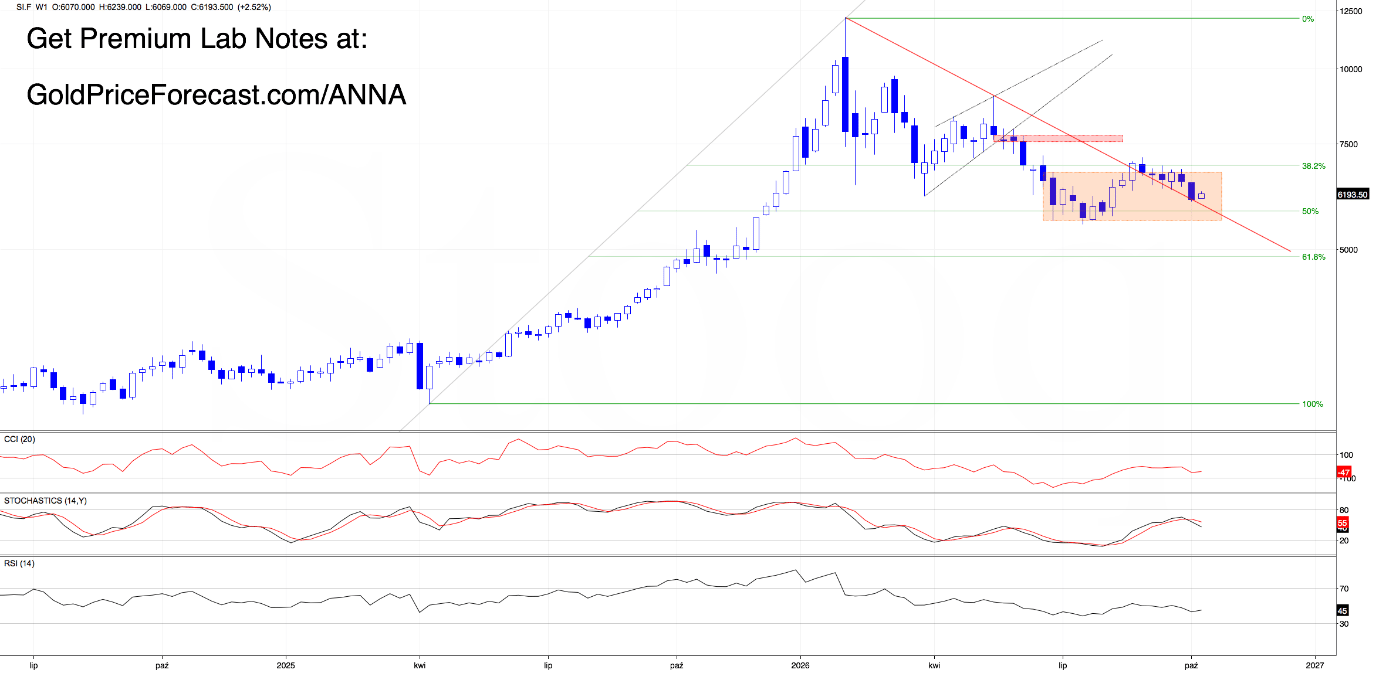
The weekly chart strengthens the bullish case.
Despite last week’s bearish attack, the previously broken red long-term downtrend line held as support, which increases the probability of a bullish counterattack during the coming week.
What would invalidate this scenario? A break below 6000 followed by a daily close below 5988, which marks the lower boundary of the black declining channel on the daily chart.
Daily Takeaway: Watch 6171 into the daily close. Holding above it would strengthen the bullish case and keep the road open toward 6466-6480 and the broader 6500 area. A break below 6000 and daily close below 5988 would invalidate the bullish setup.
If you’re following the Dollar and Silver, you’ve got the key levels above. If you want the full map, Premium also covers Gold, Platinum, Palladium, Copper and the rest of today’s setups - including the levels that could trigger the next bigger move. No hype, no forced calls - just the scenarios that matter when the market actually gives us a reason to update them.
Stay patient, respect the levels, and let the market show its hand before committing fresh risk.
Want free follow-ups to the above article and details not available to 99%+ investors? Sign up to our free newsletter today!
Author

Anna Radomska
Gold Price Forecast
Anna's passion for drawing evolved into a fascination with colorful lines and shapes, which later inspired her interest in the stock market.
















