|

Bulls hone in on a breakout for CAD/JPY

After rallying nearly 4% since the 83.76 low it’s just the May high which stands in its way to clearer skies. And whilst the daily trend structure has appeared erratic in recent times, we see a few clues which hint at a bullish breakout.

CADJPY

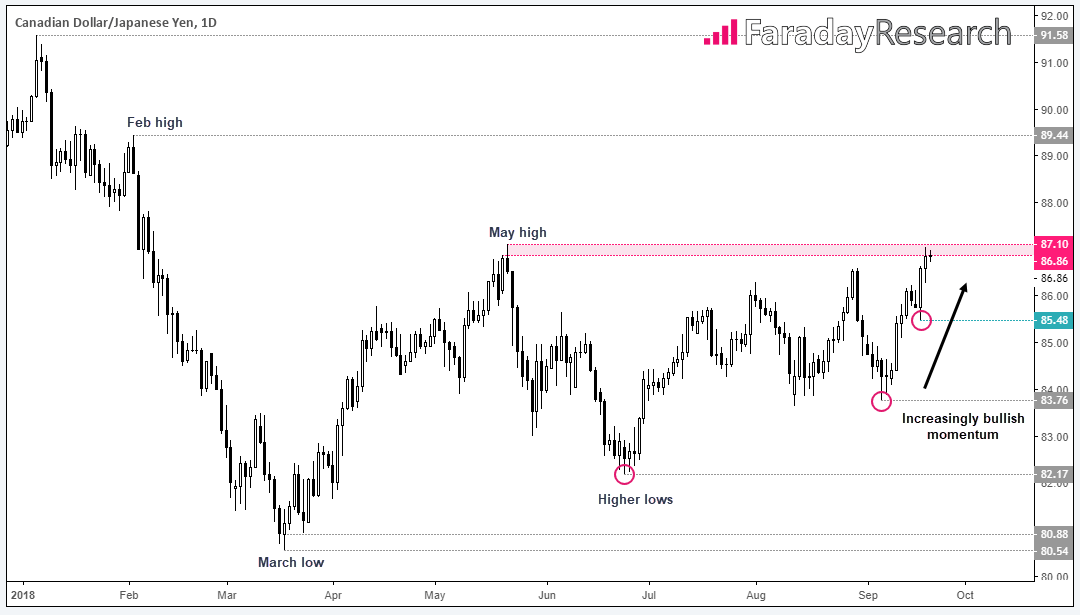
Since crashing to the 2018 low, three prominent higher lows have formed to show that bullish pressure has been slowly building since March. Moreover, bullish momentum since the 83.76 low has increased and, without any obvious signs of a top, a bullish breakout could be close.

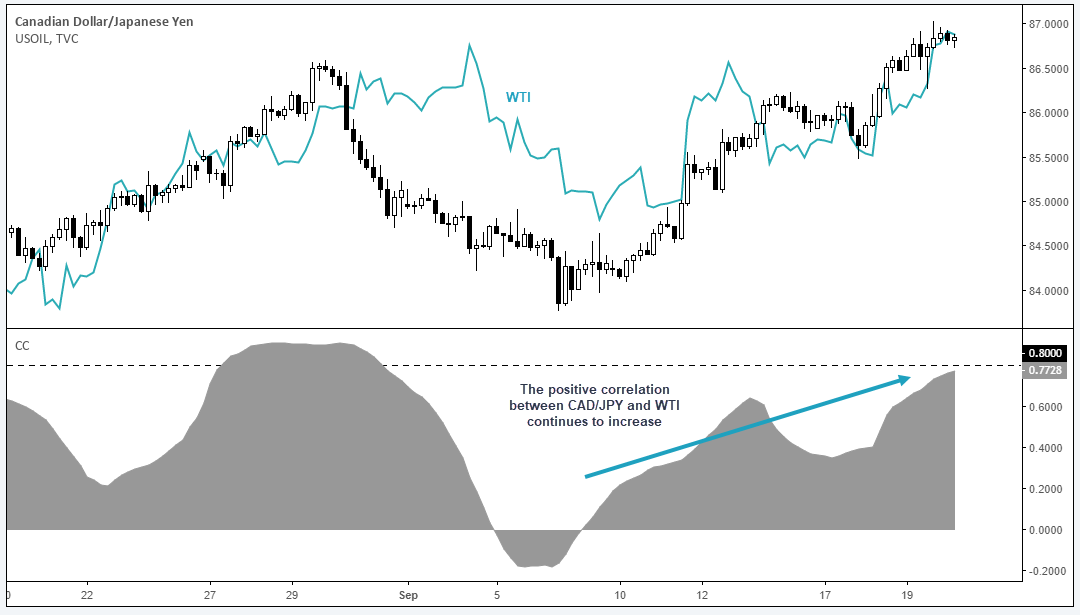
Switching to the 4-hour chart shows that WTI and CAD/JPY have been positively correlated for nearly three weeks. Furthermore, the 60-period rolling correlation is rising to show the relationship is strengthening and close to hitting 0.8 (a strong correlation). So, with WTI now above $70 we’re keeping an eye on CAD/JPY to follow suit.

CADJPY

Still, NAFTA talks continue to grind away in the background where a deal or breakdown of talks could spur volatility across CAD pairs. Also remembering that BOC continue to be “guided by data” and that “higher interest rates will be warranted”, it’s worth keeping an eye on data this week such as ADP employment later today and retail sales and CPI reads tomorrow.

But even if data is to turn against CAD, we favour an eventual upside break whilst above the 85.48 swing low. A clear break of which brings the Feb high into focus at 89.44.

Author

Matt Simpson, CFTe, MSTA

Matt Simpson is a certified technical analyst who combines charts and fundamentals to generate trading themes.

More from Matt Simpson, CFTe, MSTA
Share:

Editor's Picks

EUR/USD extends its optimism past 1.1900

EUR/USD retains a firm underlying bid, surpassing the 1.1900 mark as the NA session draws to a close on Monday. The pair’s persistent uptrend comes as the US Dollar remains on the defensive, with traders staying cautious ahead of upcoming US NFP prints and CPI data.
 

GBP/USD tilts bullish as markets barrel toward mid-week NFP print

GBP/USD is holding a broader bullish structure on the daily chart, with price trading well above the 50 Exponential Moving Average at 1.3507 and the 200 EMA at 1.3310, confirming the intermediate uptrend that has been in place since the November 2025 low near 1.2300. 

Gold pushes back above $5,000

The daily chart shows spot Gold in a parabolic uptrend that accelerated sharply from the $4,600 area in late January, printing a record high at $5,598.25 before a violent reversal erased nearly $1,000 in value during the final days of the month. 

Litecoin eyes $50 as heavy losses weigh on investors

Following a strong downtrend across the crypto market over the past week, Litecoin holders are under immense pressure. The Bitcoin fork has trimmed about $1.81 billion from its market capitalization since the beginning of the year, sending it below the top 20 cryptos by market cap.

Japanese PM Takaichi nabs unprecedented victory – US data eyed this week

I do not think I would be exaggerating to say that Japanese Prime Minister Sanae Takaichi’s snap general election gamble paid off over the weekend – and then some. This secured the Liberal Democratic Party (LDP) an unprecedented mandate just three months into her tenure.

Ripple exposed to volatility amid low retail interest, modest fund inflows

Ripple (XRP) is extending its intraday decline to around $1.40 at the time of writing on Monday amid growing pressure from the retail market and risk-off sentiment that continues to keep investors on the sidelines.