|

Bullish Elliott Wave outlook in Gold (XAU/USD) [Video]

Gold (XAUUSD) ended wave (4) at 1803.84. From here, it rallies as a 5 waves impulse Elliott Wave structure. Up from wave (4), wave ((i)) ended at 1858.33 and pullback in wave ((ii)) ended at 1809. The metal then resumes higher in wave ((iii)) towards 1914.60. Pullback in wave ((iv)) ended at 1885.40. Final leg higher wave ((v)) ended at 1937.31 which completed wave 1.

Gold 60 minutes Elliott Wave chart

Gold

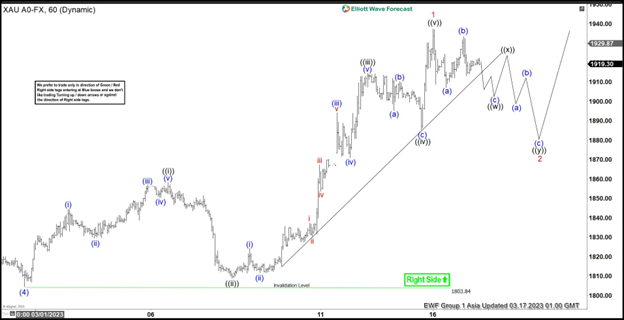
Wave 2 pullback is now in progress to correct cycle from 2.28.2023 low in larger degree 3, 7, or 11 swing before the rally resumes. Wave 2 is proposed to be unfolding as a double three Elliott Wave structure.  Down from wave 1, wave (a) ended at 1907.1 and wave (b) rally ended at 1933.42. While below wave 1 at 1937.31, expect Gold to extend lower in wave (c) of ((w)). Afterwards, it should rally in wave ((x)) before turning lower again in 3 waves to end wave ((y)) of 2. If Gold breaks above 1937.31 instead, then that means Gold is still in the process of ending wave 1.  Near term, as far as pivot at 1803.84 low stays intact, expect dips to find support in 3, 7, or 11 swing for further upside.

XAU/USD Elliott Wave video

Author

Elliott Wave Forecast Team

Elliott Wave Forecast Team

ElliottWave-Forecast.com

More from Elliott Wave Forecast Team
Share:

Markets move fast. We move first.

Orange Juice Newsletter brings you expert driven insights - not headlines. Every day on your inbox.

By subscribing you agree to our Terms and conditions.

Editor's Picks

EUR/USD bears await break below 100-day SMA support near 1.1665 area

The EUR/USD pair attracts heavy selling for the second straight day and dives to a nearly four-week trough, around the 1.1670 region, during the Asian session on Monday. Bearish traders now await a sustained break below the 100-day Simple Moving Average before positioning for an extension of the recent pullback from a three-month top, or levels just above the 1.1800 mark touched on December 24.

GBP/USD falls toward 1.3400 near 50-day EMA

GBP/USD extends its losses for the second successive session, trading around 1.3420 during the Asian hours on Monday. The technical analysis of the daily chart indicates that the 14-day Relative Strength Index at 53 has eased from near overbought, indicating that momentum has cooled while remaining above the midline. RSI holds above 50, keeping a modest bullish bias.

Gold on fire at the start of the week on US-Venezuela tensions

Gold regains upside traction early Monday as flight to safety prevails on Venezuela turmoil. The US Dollar finds strong haven demand, caps Gold’s upside as focus shifts to US jobs data. Gold’s daily technical setup suggests that more upside remains in the offing.

Bulls firmly in control as Bitcoin breaks $93K, Ethereum and Ripple extend gains

Bitcoin, Ethereum, and Ripple extended their rallies on Monday, gaining more than 4%, 6%, and 12%, respectively, in the previous week. The top three cryptocurrencies by market capitalization could continue to outperform, with bulls in control of the momentum.

Economic outlook 2026-2027 in advanced countries: Solidity test

After a year marked by global economic resilience and ending on a note of optimism, 2026 looks promising and could be a year of solid economic performance. In our baseline scenario, we expect most of the supportive factors at work in 2025 to continue to play a role in 2026.

Meme Coins Price Prediction: Dogecoin, Shiba Inu, Pepe rally on Venezuela’s shadow BTC reserve

Meme coins such as Dogecoin, Shiba Inu, and Pepe are leading the cryptocurrency market rally driven by the US cross-border operation to capture Venezuelan President Nicolás Maduro. Dogecoin extends its gain for the fifth consecutive day while SHIB and PEPE take a pause.