Brent Oil Forecast: Bollinger Bands breakout has opened doors for $80

The monthly chart of brent oil shows a big bullish breakout that could translate into a rally to $78.66 (July 2006 high).
Currently, brent is trading at $63.60 levels. A move to $78.66 would amount to 23.67 percent gains. Note that prices have already rallied 43 percent from the June low of $44.35.
The question is, should we trust the Bollinger band breakout? A detailed look at the monthly chart tells us the breakout is legitimate...
Monthly chart
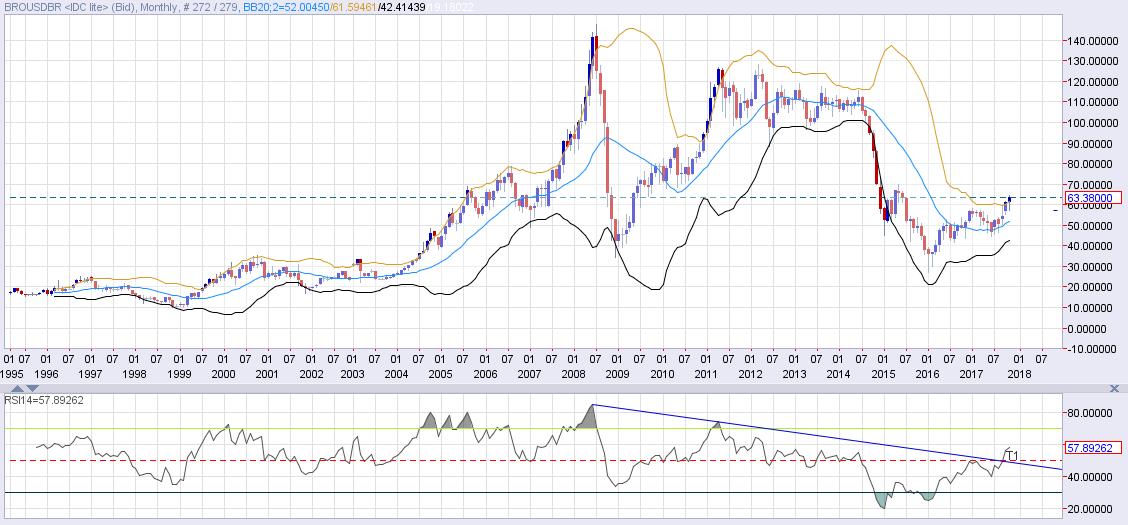
Source: Netdania
On the chart above, print prices are bracketed between the volatility bands/Bollinger bands (BB) (Std. Dev of 2) above and below the 20-day simple moving average (MA). History shows, four out of five times the bullish Bollinger band breakout yielded a stellar rally.
July 1999 bullish BB breakout
- Gap between the Bollinger bands $9.22.
- RSI was at 60.95 and trending.
- Prices rallied 64.94 percent following the breakout.
July 2004 bullish BB breakout
- Gap between the Bollinger bands was $14.61.
- RSI was at 70.00, i.e. close to being overbought and trending.
- Prices rallied 111.06 percent to $78.66 by July 2006.
Oct 2007 bullish BB breakout
- Gap between the Bollinger bands was $31.61.
- RSI was at 71.38, i.e. close to being overbought.
- Prices rallied 62 percent following a breakout and topped out at $147.47 in July 2008.
Dec 2010 bullish BB breakout
- Gap between the Bollinger bands was $27.95
- RSI was at 61.14 and trending.
- Prices rallied 34.56 percent following a breakout and topped out at $126.88 in April 2011.
Feb 2003 failed bullish BB breakout
- Gap between the Bollinger bands was $13.97.
- RSI was at 64.68 and trending.
- But the breakout failed. In the following month (Mar. 2003), prices closed well below $30.31 (Feb. 2003 low).
Let us see if the latest breakout is similar to the ones discussed above...
Oct 2017 bullish BB breakout
- Gap between the Bollinger bands was $18.85.
- The RSI was at 55 (bullish, but lowest when compared to what it was at the time of past BB breakouts). It only validates the argument that there is plenty scope for a rally.
View - So there is every reason that the historical pattern would work this time as well, i.e. prices could easily rally to $78-$80 levels next year. The bullish view or the bollinger breakout risks failing if prices end this month below $55.05 (previous month's/breakout month's low).
The other pattens on the monthly chart also highlight the strength in the market.
- Oil bottomed out in Feb 2016 and since then has been rising on the back of a bullish-price RSI divergence.
- Also, a bearish crossover between the 50-MA and 200-MA happened last month. The crossover is a lagging indicator and often works the other way round in the short-term.
Author

Omkar Godbole
FXStreet Contributor
Omkar Godbole, editor and analyst, joined FXStreet after four years as a research analyst at several Indian brokerage companies.


