Brent crude technical analysis: Will the Brent quotes continue to decline?

Brent crude technical analysis summary
Sell Stop: Below 70.
Stop Loss: Above 83.
| Indicator | Signal |
| RSI | Neutral |
| MACD | Sell |
| MA(200) | Sell |
| Fractals | Sell |
| Parabolic SAR | Sell |
| Bollinger Bands | Sell |
Brent crude chart analysis
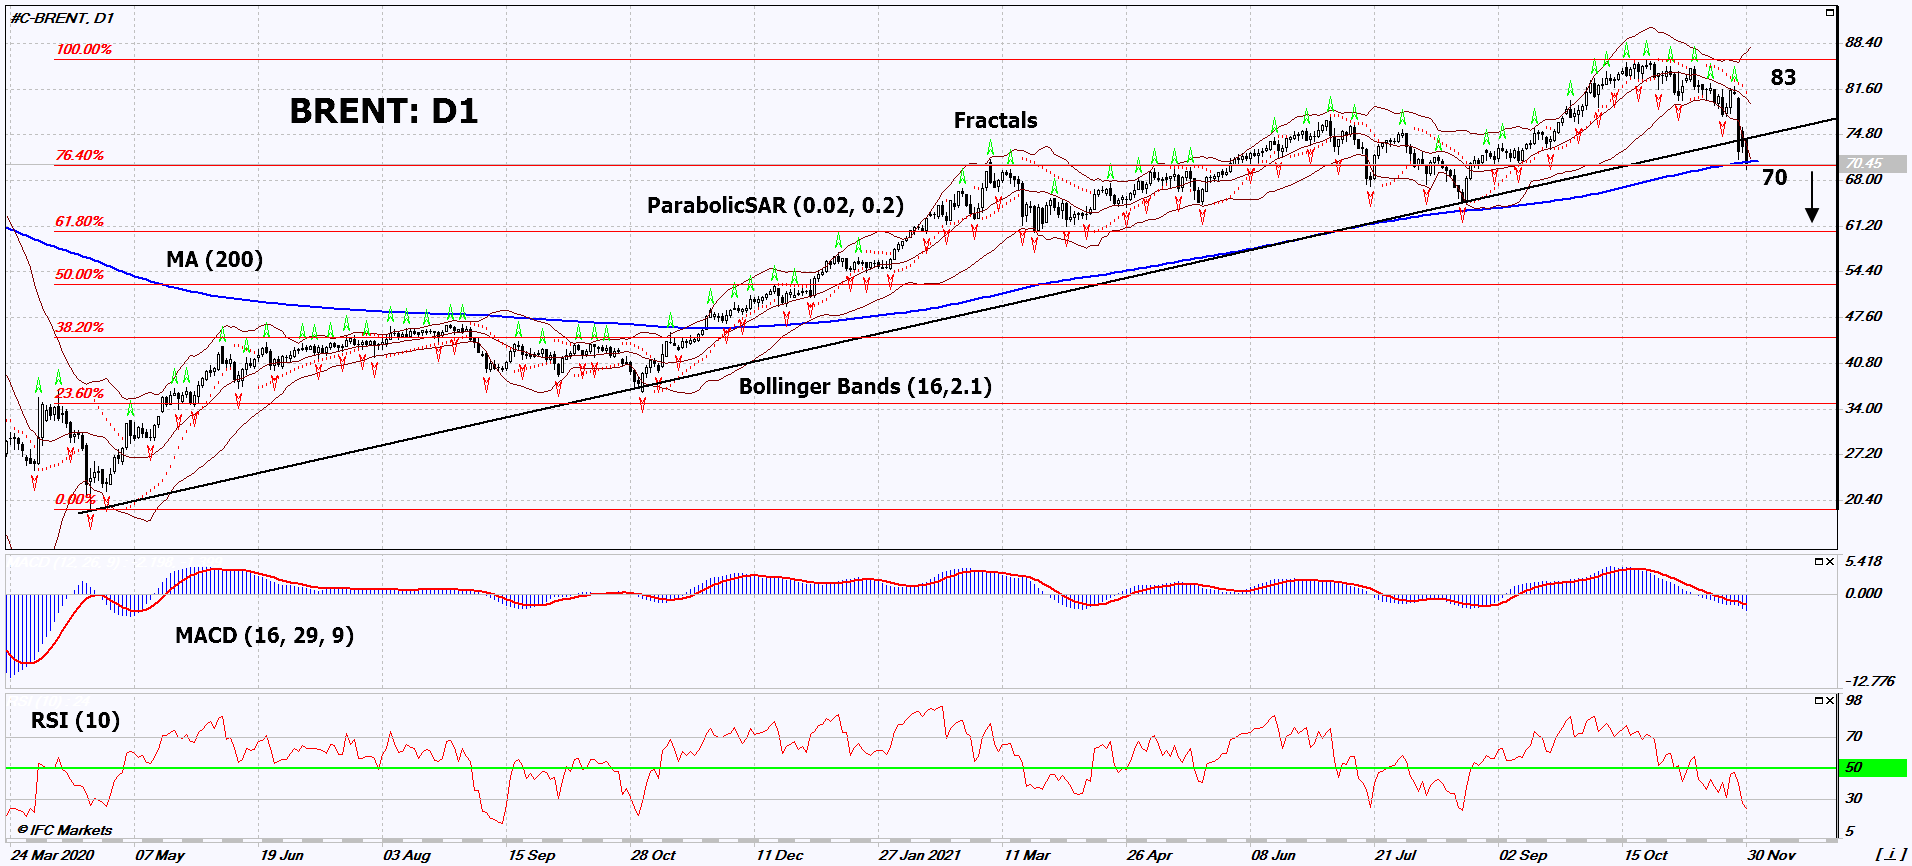
On the daily timeframe, BRENT: D1 broke down the support line of the long-term uptrend. A number of technical analysis indicators have generated signals for further decline. We do not rule out a bearish movement if BRENT: D1 falls below the last low: 70. This level can be used as an entry point. The initial risk limitation is possible above the last upper fractal, the 200-day moving average line and the Parabolic signal: 83. After opening the pending order, move the stop following the Bollinger and Parabolic signals to the next fractal maximum. Thus, we change the potential profit/loss ratio in our favor. The most cautious traders, after making a deal, can go to the four-hour chart and set a stop-loss, moving it in the direction of movement. If the price overcomes the stop level (83) without activating the order (70), it is recommended to delete the order: there are internal changes in the market that were not taken into account.
Fundamental analysis of commodities – Brent crude
The risks of a new global lockdown have increased. Will the BRENT quotes continue to decline?
The manufacturer of one of the Covid-19 vaccines, Moderna, has expressed doubts that the vaccines will be effective against the new variant of the coronavirus, Omicron, as well as against the previous variant of Delta. A similar opinion was expressed by the American manufacturer of the drug for the coronavirus Regeneron. This contributed to the drop in world oil prices on Tuesday. Investors recalled that at the height of the coronavirus epidemic last year, oil prices fell almost to zero. The main reason for this was the introduction of quarantine in almost all countries and the reduction in motor fuel consumption. Note that the share of oil in the world used for the needs of road, sea, aviation and other transport reaches 60%. Market participants are now awaiting the next OPEC + meeting, which will be held on December 2, 2021. If the cartel members abandon the planned increase in production by 400 thousand barrels per day from the beginning of January 2022, then this could slow down the decline in oil prices. However, this is not yet very likely. Saudi Arabia's Energy Minister Prince Abdel Aziz bin Salman and Russian Deputy Prime Minister Alexander Novak said they should not worry about the new Omicron coronavirus strain for now.
Want to get more free analytics? Open Demo Account now to get daily news and analytical materials.
Want to get more free analytics? Open Demo Account now to get daily news and analytical materials.
Author

Dmitry Lukashov
IFC Markets
Dimtry Lukashov is the senior analyst of IFC Markets. He started his professional career in the financial market as a trader interested in stocks and obligations.


