Bitcoin Analysis: Doji candle seen, selling likely to gather pace below $4190

Bitcoin Analysis: Doji candle seen, selling likely to gather pace below $4190
Bitcoin [BTC] clocked a fresh session high of $4464 yesterday before falling back to $4200 levels. The price action confirmed a bearish RSI divergence on the 4-hour chart, although the downside in the currency pair has been capped just above $4181- which is 161.8% Fib extension of $1842.70-$2946.01-$2398.01.
Technicals
Daily chart - Bull market exhaustion
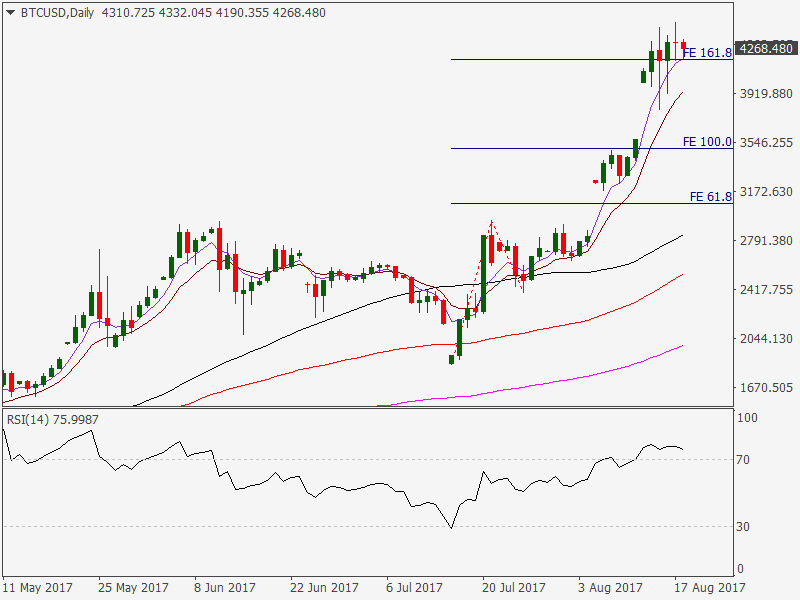
Yesterday’s Doji candle coupled with the overbought 14-day RSI signals bull market exhaustion. Note that the Doji candle alone does not confirm trend reversal… nor does the overbought RSI. What we need here is a bearish follow through i.e. a negative price action today would add credence to the Doji candle and the overbought RSI and shall confirm the bearish trend reversal. Let us drill down to the 4-hour chart, which shows the profit taking could gather pace below $4190 levels.
4-hour chart
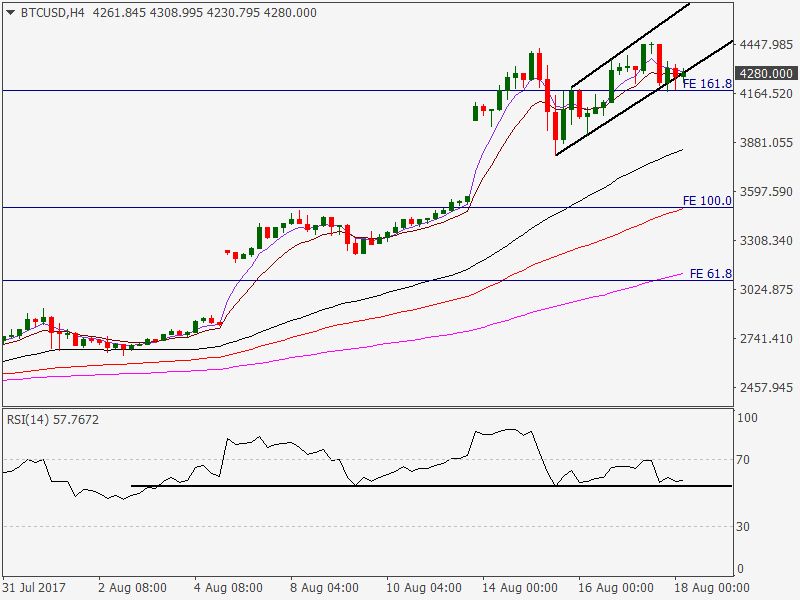
Observations
- Bearish price RSI divergence
- Rising channel - resistance at around $4650, support around $4284
- Head and shoulders pattern on the RSI
Bearish divergence followed by a downside break of the rising channel indicates scope for a sell-off; however, the downside is being capped around $4190.
View:
- Selling is seen gathering pace once prices breach support at $4190. Such a move would also yield a head and shoulders breakdown on the RSI, in which case the support at $3837 [4-hour 100-MA] could be put to test.
- A bearish price action today would confirm the trend reversal on the daily chart and open doors for $3500 levels.
- Bullish scenario: Rebound from $4190 if yields a break above $4464 would open up upside towards rising channel resistance seen around $4650 levels.
Author

Omkar Godbole
FXStreet Contributor
Omkar Godbole, editor and analyst, joined FXStreet after four years as a research analyst at several Indian brokerage companies.


