Bearish signal in S&P 500: Wyckoff upthrust and this bearish volume pattern [Video]
![Bearish signal in S&P 500: Wyckoff upthrust and this bearish volume pattern [Video]](https://editorial.fxstreet.com/images/Markets/Equities/SP500/wall_street_nyse3-637299021683820849.jpg)
Find out how to spot Wyckoff upthrust and the bearish volume pattern in S&P 500. Key support & resistance levels or Dow Jones, Nasdaq 100 and Russell 2000 are illustrated in the video.
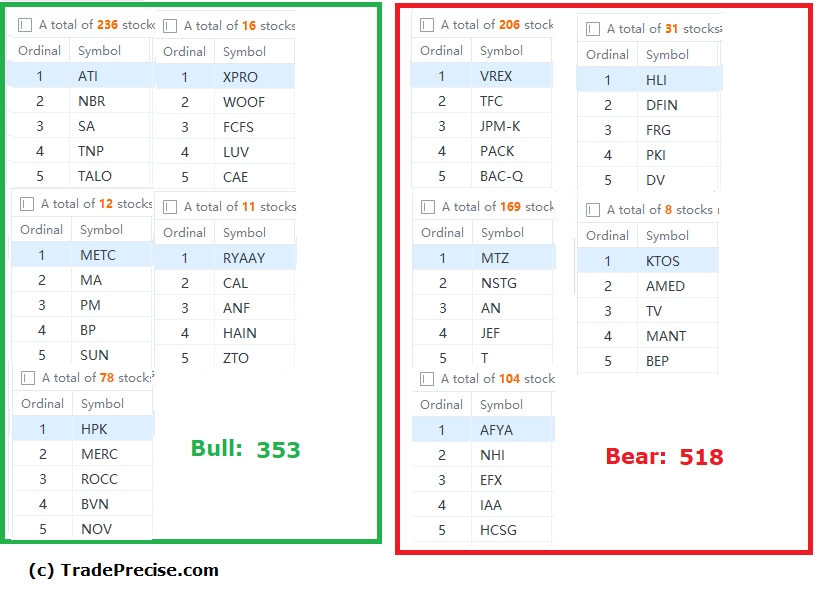
Lots of great bullish setup in the commodity sector especially oil and gas industry group. The plan is to focus on the outperforming sectors and trade the leading stocks showing up with great entry to get decent reward to risk ratio. Refer to the screenshot of bullish and bearish stocks from the stock screener.
Author

Ming Jong Tey
Independent Analyst
Ming Jong Tey has been trading since 2008. He started his learning journey from technical analysis (indicators, Fibonacci, etc...) to value investing. Throughout his journey, he develops an interest in price action with chart pattern trading.


