Australian Dollar Price Forecast: Weakness threatens the 200-day SMA
- AUD/USD resumed its decline and dropped to eight-week lows near 0.6440.
- The US Dollar faced some renewed selling pressure ahead of Powell’s speech.
- The US and China seem to have embarked on a fresh round of trade tensions.
The Australian Dollar (AUD) couldn’t find much traction on Tuesday, slipping further as the US Dollar (USD) kept up its recovery. Fresh jitters over US–China trade relations also soured sentiment toward the Aussie.
By the end of the day, AUD/USD had extended its retreat toward the 0.6440 area, its weakest level in eight weeks, adding weight to the broader monthly pullback.
Domestic data still holding up
Despite the risk-off tone in markets, Australia’s underlying data continues to show a bit of resilience. The final September manufacturing and services PMIs both eased slightly but stayed above 50, signalling continued expansion.
Retail Sales rose 1.2% in June, the August trade surplus only narrowed modestly to A$1.825 billion, and business investment kept growing through Q2. GDP was up 0.6% in the April-June quarter and 1.8% YoY, not spectacular, but steady enough.
The labour market, though, has lost a little momentum. The unemployment rate held at 4.2% in August, but total employment fell by 5.4K. It’s hardly a red flag yet, but it does hint that growth is beginning to cool around the edges.
RBA stays watchful on inflation
Inflation remains front and centre for the Reserve Bank of Australia (RBA). The August Monthly CPI Indicator (Weighted Mean) ticked up to 3.0% from 2.8%, while Q2 CPI rose 0.7% QoQ and 2.1% YoY. The Melbourne Institute’s October Consumer Inflation Expectations also nudged higher to 4.8%.
That was enough to keep the RBA cautious at its 30 September meeting. The cash rate stayed on hold at 3.60%, as widely expected, but officials backed away from earlier hints of possible easing. Policymakers noted that disinflation might be slowing after the CPI surprise, with Q3 inflation likely to come in hotter than the 2.6% forecast.
Governor Michele Bullock has stuck to a consistent message: decisions will remain data-dependent and assessed meeting by meeting. Rate cuts aren’t ruled out, but the RBA wants firmer evidence that supply–demand imbalances are easing.
For now, trimmed mean CPI at 2.7% YoY in Q2 sits comfortably within the 2–3% target band. Markets are pricing in around 15 bps of easing by year-end and roughly 28 bps by late 2026.
China still in the driver’s seat
Australia’s outlook remains closely tied to China’s uneven recovery. Q2 GDP expanded 5.2% YoY, but August retail sales disappointed at 3.4%. September’s PMIs painted a mixed picture: manufacturing remained in contraction at 49.8, while services just held the 50.0 line.
China’s September trade surplus also narrowed to $90.45 billion (from $103.33 billion), and inflation looks set to stay near deflationary territory in September after August’s CPI slipped to 0.4% YoY.
Meanwhile, the People’s Bank of China (PBoC) left its Loan Prime Rates (LPR) unchanged in September: the one-year at 3.00% and the five-year at 3.50%, broadly in line with consensus.
Market positioning still thin
Speculative interest in the Aussie remains subdued. With Commodity Futures Trading Commission (CFTC) data delayed due to the US government shutdown, the latest available figures to 23 September still showed a clear tilt toward net shorts among non-commercial traders, suggesting much of the bearish sentiment is already baked in.
Technical view
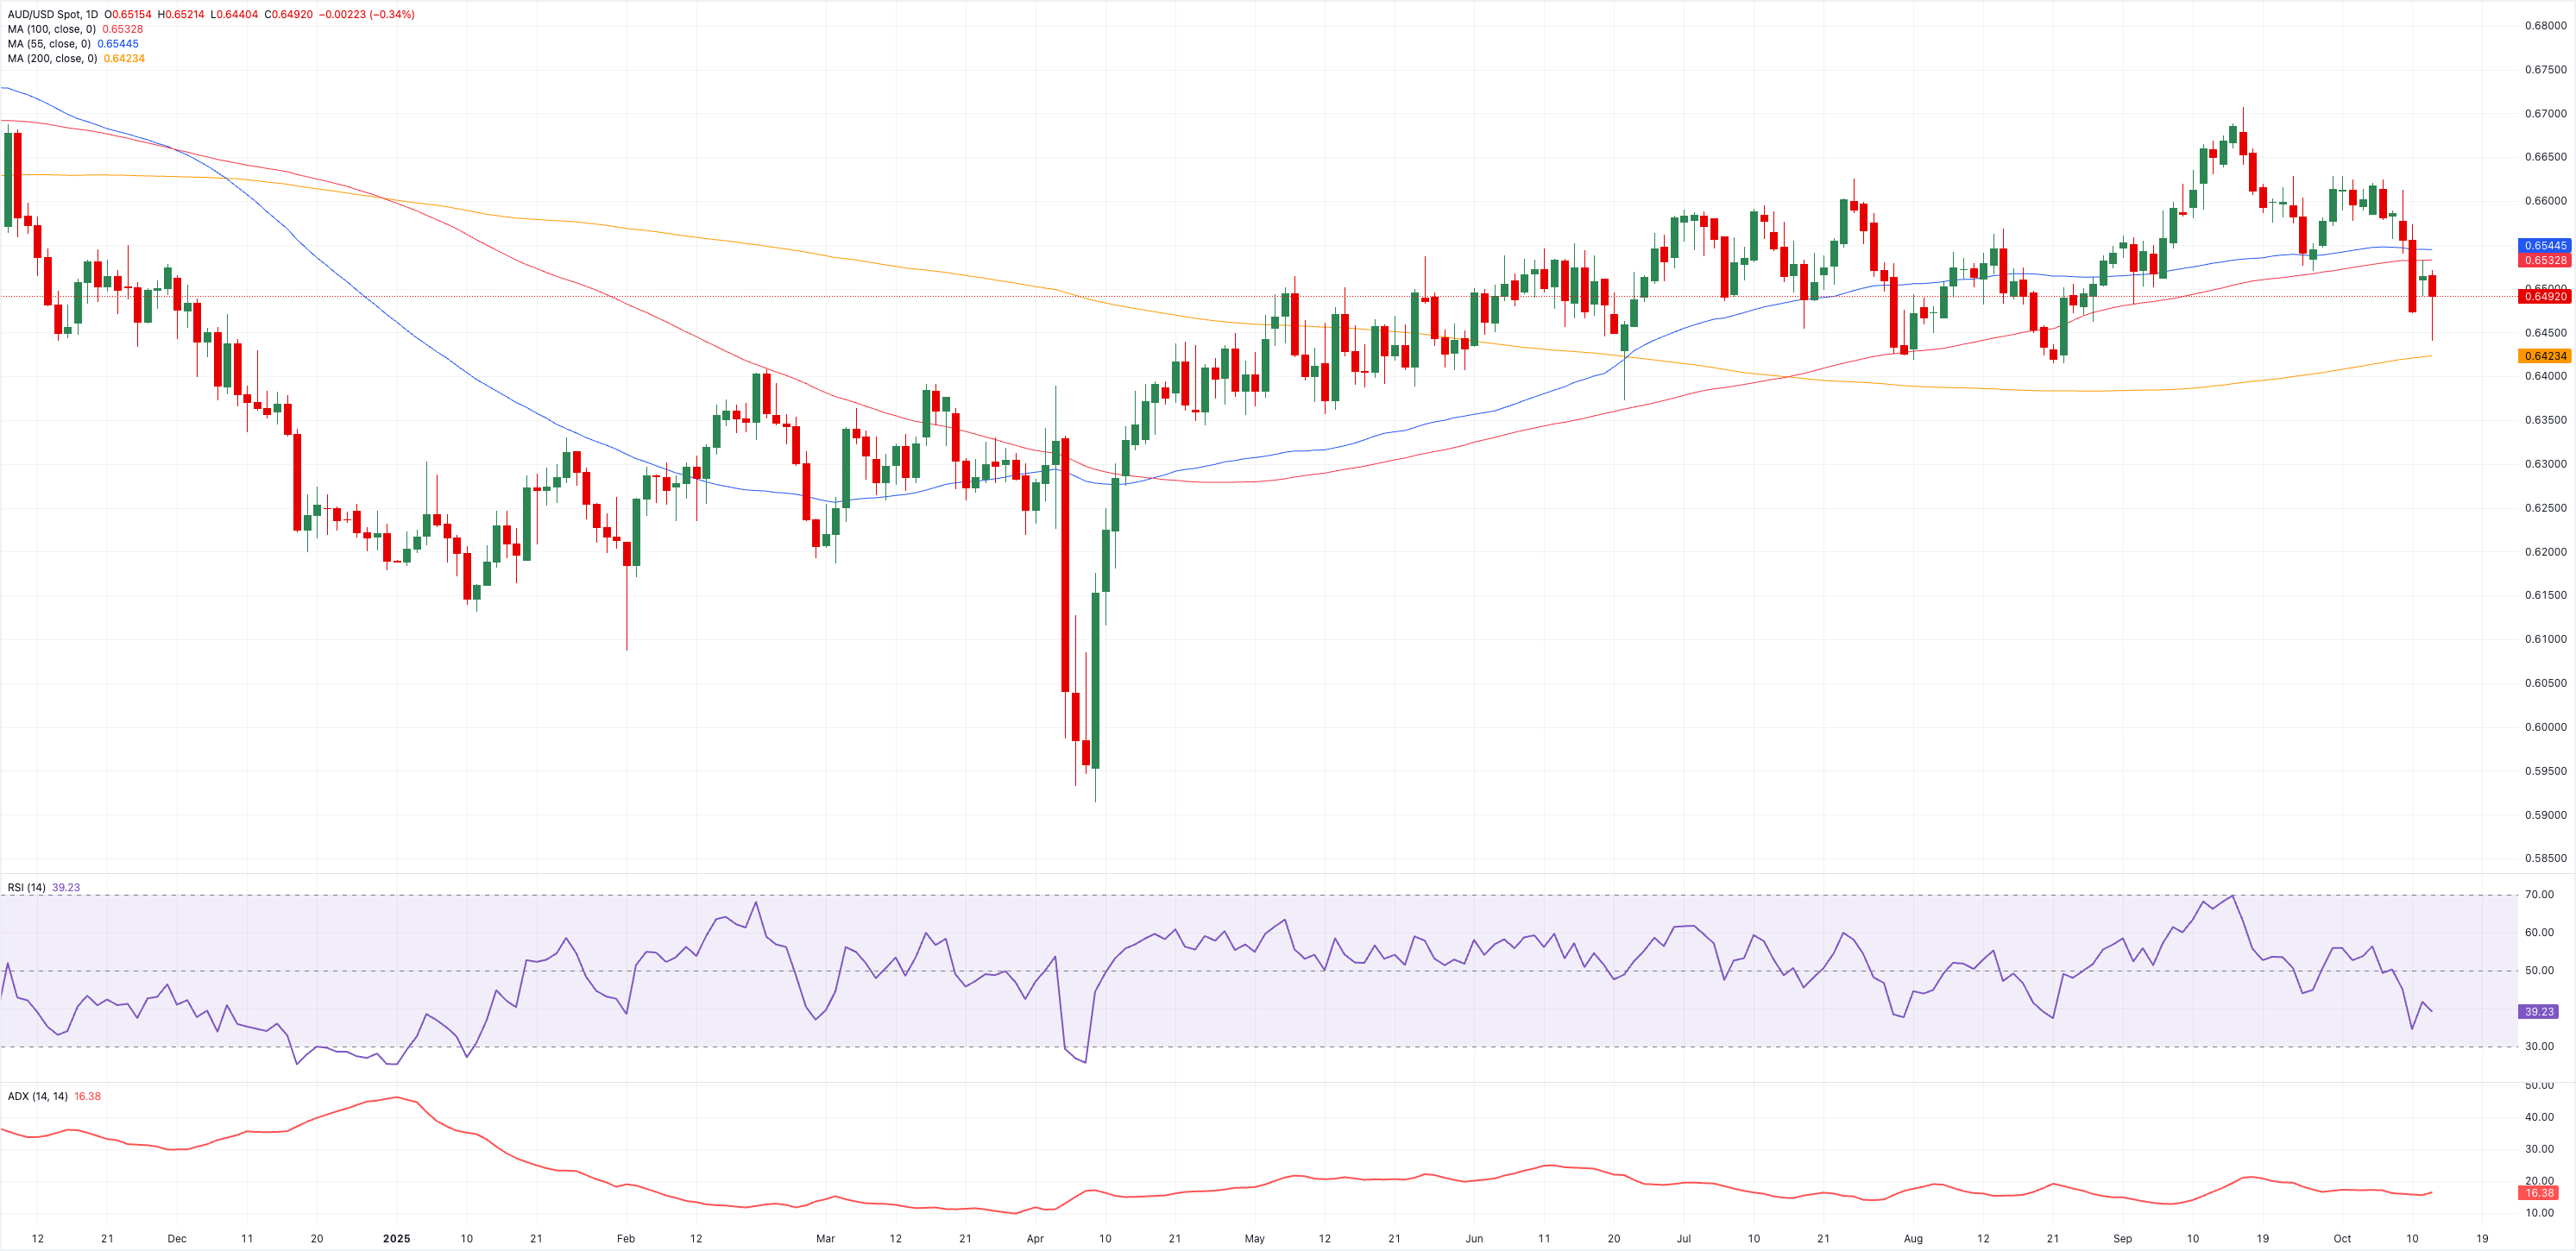
AUD/USD risks a probable descent to its critical 200-day SMA near 0.6420.
That said, the continuation of the current bearish trend should face the next key contention zone at the 200-day SMA, closely followed by the August floor at 0.6414 (August 21) and then the June base at 0.6372 (June 23).
In contrast, occasional bullish attempts should initially retarget the October ceiling at 0.6629 (October 1), ahead of the 2025 top at 0.6707 (September 17). North from here comes the 2024 high at 0.6942 (September 30), prior to the 0.7000 threshold.
Momentum indicators lean bearish: the Relative Strength Index (RSI) hovers around 39, suggesting that the selling momentum still dominates, while the Average Directional Index (ADX) just over 16 indicates that the current trend lacks muscle.
AUD/USD daily chart
Looking for a spark
All told, AUD/USD remains locked in a broad 0.6400–0.6700 range. It’ll likely take a clear catalyst: stronger Chinese data, a dovish turn from the Fed, or a softer stance from the RBA to break the pair decisively out of this holding pattern.
Australian Dollar FAQs
One of the most significant factors for the Australian Dollar (AUD) is the level of interest rates set by the Reserve Bank of Australia (RBA). Because Australia is a resource-rich country another key driver is the price of its biggest export, Iron Ore. The health of the Chinese economy, its largest trading partner, is a factor, as well as inflation in Australia, its growth rate and Trade Balance. Market sentiment – whether investors are taking on more risky assets (risk-on) or seeking safe-havens (risk-off) – is also a factor, with risk-on positive for AUD.
The Reserve Bank of Australia (RBA) influences the Australian Dollar (AUD) by setting the level of interest rates that Australian banks can lend to each other. This influences the level of interest rates in the economy as a whole. The main goal of the RBA is to maintain a stable inflation rate of 2-3% by adjusting interest rates up or down. Relatively high interest rates compared to other major central banks support the AUD, and the opposite for relatively low. The RBA can also use quantitative easing and tightening to influence credit conditions, with the former AUD-negative and the latter AUD-positive.
China is Australia’s largest trading partner so the health of the Chinese economy is a major influence on the value of the Australian Dollar (AUD). When the Chinese economy is doing well it purchases more raw materials, goods and services from Australia, lifting demand for the AUD, and pushing up its value. The opposite is the case when the Chinese economy is not growing as fast as expected. Positive or negative surprises in Chinese growth data, therefore, often have a direct impact on the Australian Dollar and its pairs.
Iron Ore is Australia’s largest export, accounting for $118 billion a year according to data from 2021, with China as its primary destination. The price of Iron Ore, therefore, can be a driver of the Australian Dollar. Generally, if the price of Iron Ore rises, AUD also goes up, as aggregate demand for the currency increases. The opposite is the case if the price of Iron Ore falls. Higher Iron Ore prices also tend to result in a greater likelihood of a positive Trade Balance for Australia, which is also positive of the AUD.
The Trade Balance, which is the difference between what a country earns from its exports versus what it pays for its imports, is another factor that can influence the value of the Australian Dollar. If Australia produces highly sought after exports, then its currency will gain in value purely from the surplus demand created from foreign buyers seeking to purchase its exports versus what it spends to purchase imports. Therefore, a positive net Trade Balance strengthens the AUD, with the opposite effect if the Trade Balance is negative.
Author

Pablo Piovano
FXStreet
Born and bred in Argentina, Pablo has been carrying on with his passion for FX markets and trading since his first college years.

















