Australian Dollar Price Forecast: Hot inflation, solid data, but still can’t break higher
- AUD/USD traded in an inconclusive fashion around the 0.6500 region midweek.
- The US Dollar gathered fresh pace amid jitters over the Fed’s independence.
- The Monthly CPI Indicator unexpectedly rose in July.

The Australian Dollar (AUD) chopped around on Wednesday, with AUD/USD flipping between gains and losses near the 0.6500 mark. The pair’s lack of conviction came as the US Dollar (USD) stayed firm and risk-related assets remained broadly under pressure.
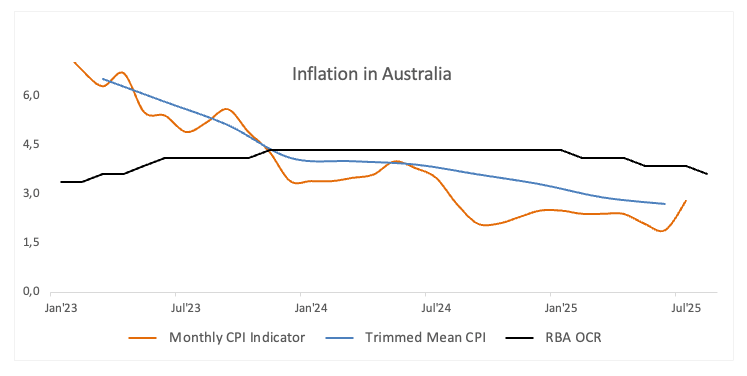
Inflation still running hot
July’s Monthly CPI Indicator (Weighted Mean) jumped to 2.8%, up from 1.9% the month before. Q2 CPI climbed 0.7% QoQ and 2.1% YoY, keeping price pressures in focus and reinforcing the Reserve Bank of Australia’s (RBA) cautious tone.
The economy shows resilience
Beyond inflation, the data run has looked solid. Early August PMIs surprised to the upside, with manufacturing at 52.9 and services at 55.1. Retail sales popped 1.2% in June, while the trade surplus widened sharply to A$5.365B. The labour market is still tight, unemployment slipped to 4.2% in July as 24.5K jobs were added.
RBA: Data-dependent and cautious
The RBA trimmed rates by 25 basis points earlier this month to 3.60% and lowered its 2025 growth outlook.
Governor Michele Bullock pushed back against a bigger cut, repeating that policy remains “data-dependent.” Markets are now pricing another 25 basis point move by November 5.
The bank’s Minutes released earlier this week also highlighted that faster cuts are possible if the labour market eases, but the RBA would stick to a slower path if conditions remain tight.
China remains the swing factor
China’s growth is still mixed. The GDP rose 5.2% YoY in the April-June period, while industrial output expanded 7%, and retail sales disappointed expectations. PMIs slipped back under 50, trade data showed a narrowing surplus, and inflation stayed flat. The People’s Bank of China (PBoC) left key lending rates unchanged last week, as expected.
Market positioning: Speculators remain (very) bearish
Commitment of Traders (CFTC) data showed net shorts on the Aussie hitting their highest since April 2024, while open interest also climbed to a two-month peak, underscoring a more bearish tone.
Technical picture
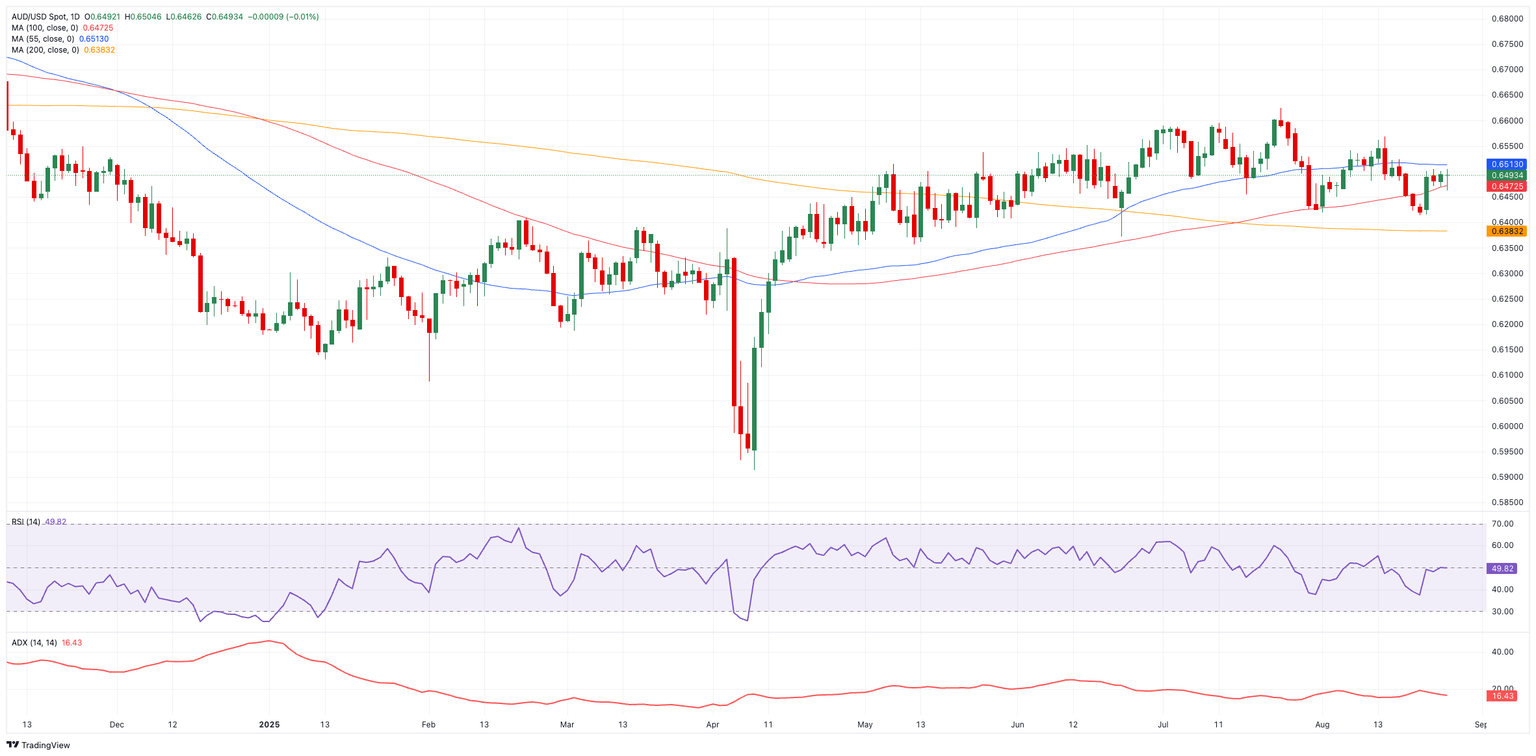
AUD/USD is still struggling to find direction within familiar levels. On the upside, the first real test is the 2025 ceiling at 0.6625 (July 24). If buyers can push through there, the next key level is the November 2024 peak at 0.6687 (November 7), and beyond that the bigger psychological target sits at 0.7000.
On the downside, support is holding for now at 0.6414 (August 21). A break lower would bring the 200-day Simple Moving Average (SMA) at 0.6384 into view, followed closely by the June floor at 0.6372 (June 23).
However, momentum signals apear mixed. The Relative Strength Index (RSI) gyrates around the 50 yardstick, suggesting there’s still some room for further gains. Additionally, the Average Directional Index (ADX) hovers near 16, indicating that the ongoing trend lacks juice.
AUD/USD daily chart
Short-term outlook
AUD/USD remains boxed in a 0.6400–0.6600 consolidative range. Breaking out will likely need a stronger catalyst: A more solid improvement from Chinese data, a meaningful shift in Federal Reserve (Fed) policy, or fresh signals from the RBA.
Inflation FAQs
Inflation measures the rise in the price of a representative basket of goods and services. Headline inflation is usually expressed as a percentage change on a month-on-month (MoM) and year-on-year (YoY) basis. Core inflation excludes more volatile elements such as food and fuel which can fluctuate because of geopolitical and seasonal factors. Core inflation is the figure economists focus on and is the level targeted by central banks, which are mandated to keep inflation at a manageable level, usually around 2%.
The Consumer Price Index (CPI) measures the change in prices of a basket of goods and services over a period of time. It is usually expressed as a percentage change on a month-on-month (MoM) and year-on-year (YoY) basis. Core CPI is the figure targeted by central banks as it excludes volatile food and fuel inputs. When Core CPI rises above 2% it usually results in higher interest rates and vice versa when it falls below 2%. Since higher interest rates are positive for a currency, higher inflation usually results in a stronger currency. The opposite is true when inflation falls.
Although it may seem counter-intuitive, high inflation in a country pushes up the value of its currency and vice versa for lower inflation. This is because the central bank will normally raise interest rates to combat the higher inflation, which attract more global capital inflows from investors looking for a lucrative place to park their money.
Formerly, Gold was the asset investors turned to in times of high inflation because it preserved its value, and whilst investors will often still buy Gold for its safe-haven properties in times of extreme market turmoil, this is not the case most of the time. This is because when inflation is high, central banks will put up interest rates to combat it. Higher interest rates are negative for Gold because they increase the opportunity-cost of holding Gold vis-a-vis an interest-bearing asset or placing the money in a cash deposit account. On the flipside, lower inflation tends to be positive for Gold as it brings interest rates down, making the bright metal a more viable investment alternative.
Premium
You have reached your limit of 3 free articles for this month.
Start your subscription and get access to all our original articles.
Author

Pablo Piovano
FXStreet
Born and bred in Argentina, Pablo has been carrying on with his passion for FX markets and trading since his first college years.


