Australian Dollar Price Forecast: Focus shifts to data
- AUD/USD recedes from fresh two-month highs near 0.7130.
- Disappointing labour market results in Oz are also weighing on the AUD.
- Flash August PMIs will be the main focus in the domestic docket on Friday.
Waiting for a clearer signal
Base case: while above the 200-day SMA past 0.6940, spot should maintain the neutral-to-bullish stance. Of note is that the pair is flirting with the overbought zone, which carries the potential to, eventually, trigger a “technical” correction.
Australia’s relatively solid domestic fundamentals and the RBA’s cautious stance should discourage aggressive selling. At the same time, bouts of fresh demand for the US Dollar (USD) and geopolitical uncertainty could prevent an immediate breakout.
Bullish case: A convincing move beyond 0.7100, ideally supported by firm Australian data, stronger expectations of another RBA rate increase, lower US yields or a widespread improvement in risk appetite.
Under this scenario, there is a minor target at the monthly top at 0.7132 (August 20), ahead of the next important medium-term target at 0.7200 (May 29 peak), all preceding the 2026 ceiling at 0.7277 (May 6).
The sizeable build-up of speculative AUD shorts could add fuel to the move if a confirmed breakout forces bearish traders to unwind their positions.
Bearish case: A sustainable retracement to the sub-0.7000 region, amid a resurgence of USD strength or generalised weakness in market sentiment, would bring sellers back into the market, with the subsequent target emerging at the 200-day SMA.
A daily close below this area would damage the wider constructive structure and increase the probability of a deeper correction.
Once that contention zone gives way, the focus of attention should shift toward the June floor at 0.6865 (June 30).
The Australian economy keeps its footing
Australia’s domestic backdrop remains relatively healthy, supported by firm demand, positive growth and a resilient labour market.
July business surveys reinforced that picture. The Manufacturing PMI improved to 52.0 from 51.5, while the Services PMI rose to 53.6 from 50.5, leaving both sectors comfortably in expansionary territory.
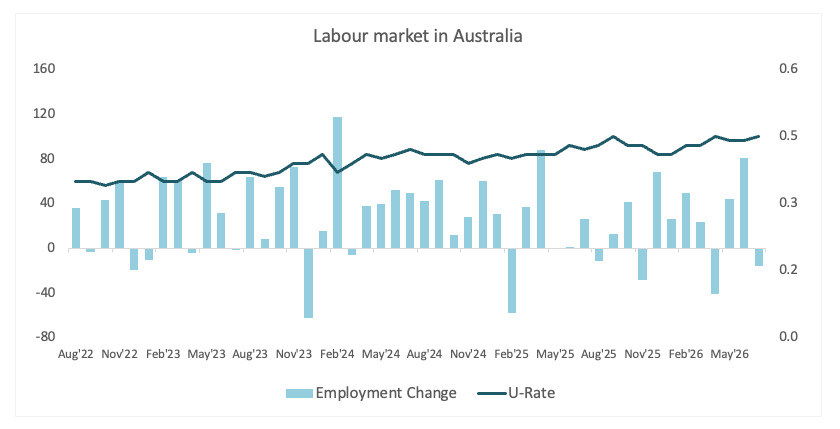
The July data from the labour market were, however, discouraging, after the Unemployment Rate ticked higher to nearly 5-year highs at 4.5%, while the Employment Change unexpectedly dropped by 15.8K following a revised 80.3K increase in June.
The picture remains, meanwhile, broadly positive after Australia recorded an A$1.929 billion trade surplus in June, reversing May’s A$2.367 billion deficit. Removing some shine, economic growth slowed to 0.3% QoQ (from 0.9%) in the January-March period according to the latest Gross Domestic Product (GDP) data, while annual growth held at 2.5%.
Overall the figures suggest a resilient economy but perhaps not strong enough on its own to trigger a sustained breakout in AUD/USD.
Inflation leaves the RBA with unfinished work
Australian headline inflation eased to 3.9% in the second quarter from 4.1%. Underlying price pressures, however, remained uncomfortable. Both the Trimmed Mean and Weighted Median measures rose to 3.6% from 3.5% in the previous quarter.
Consumer inflation expectations reinforced the view of sticky prices after they ticked higher to 4.9% in August (from 4.7%), according to the Melbourne Institute. All in all, inflation remains too high for the RBA to declare victory.
Back to the RBA, it left its Official Cash Rate (OCR) unchanged at 4.35% earlier in the month, delivering another cautious message. Policymakers warned that further tightening could still be required if inflation proves more persistent than expected.
The RBA also deemed monetary policy to be relatively restrictive after three rate rises this year. But the Board did hint at another hike, and Governor Michele Bullock said a rate drop wasn't on the table. Another raise was still possible if the latest data revealed sustained inflationary pressures, she added.
Regarding inflation: the Trimmed Mean is expected to be 3.3% in Q4 2026, over 3% until mid-2027, then down to 2.5% in early 2028. Headline inflation is expected at 3.6% in Q4 2026, 2.6% in Q4 2027 and 2.4% in Q4 2028. Still, short-term inflation predictions have softened but are above where they were earlier this year.
On the labour market front, it’s still a little tight, with very little near-term relief projected. The unemployment rate is expected to increase from 4.5% in Q4 2026 to 4.7% in Q4 2027 and 4.8% in Q4 2028. Slower economic growth and less tightness in the labour market were needed to bring inflation back to goal in a sustainable manner, Bullock said.
Finally, the RBA predicts modest growth with GDP at 1.4% in Q4 2026, 1.6% in Q4 2027 and 1.8% in Q4 2028. The fact that the housing market had been worse than expected will not deter the Board from hiking rates, Bullock said.
Overall, the conference produced a hawkish position. The RBA is waiting for further information, but another rate hike is still possible, while cuts are not on the table for now.
In the meantime, market participants pencil in just over 4 basis points of tightening by year-end, while consensus expects the central bank to keep its hand steady at its September 29 meeting.
China stabilises but provides little more support
China remains an important influence on the Australian currency, although it is currently providing stability rather than a powerful tailwind.
The Chinese economy expanded by 4.3% YoY in the April-June period, while Industrial Production has lost some traction and rose by 4.5% in the year to June, and Retail Sales increased by a modest 0.6% over the last twelve months.
Business surveys indicate divergent activity after the National Bureau of Statistics (NBS) reported Manufacturing PMI at 49.2 in July (from 50.3) and Services at 49.0 (from 50.2), while private measures like RatingDog remain in expansionary territory, with Manufacturing at 50.9 (from 51.7) and Services at 50.4 (from 54.1).
China’s trade surplus also widened to $125.62 billion in June from $105.4 billion, supported by stronger imports and exports.
Meanwhile, the People’s Bank of China (PBoC) maintained its Loan Prime Rates (LPR) unchanged at its meeting early on Thursday, with the one-year rate at 3.00% and the five-year rate at 3.50%, widely in line with the analysts’ estimates.
China is therefore neither delivering a major boost nor creating a significant drag. Unless the data show a clearer acceleration or deterioration, Chinese releases may cause short-term volatility without setting a lasting direction for the pair.
Bears return, but the overall selling trend stabilises
Speculative sentiment towards the Australian Dollar weakened again in the week ending August 11, according to the Commodity Futures Trading Commission (CFTC) latest report. That said, net shorts widened to around 39.2K contracts, while the weekly change swung back to -6.0K contracts after the prior week's nearly 6.8K improvement, effectively reversing much of that short-covering move.
The renewed deterioration came alongside a sizeable increase in participation, with open interest rising to 267.2K contracts (from 240.5K). In addition, Speculative Exposure slipped to -14.7% from -13.8%. Rising open interest alongside deeper net shorts suggests bearish positions are once again being added rather than the move being driven purely by the liquidation of existing longs.
The broader picture is more stable, however. The 4-week change was virtually unchanged at around -8.5K contracts, showing that the cumulative deterioration in positioning has stopped accelerating. The Net Position Percentile also fell down to 68.5, and the Speculative Exposure Percentile is still high at 80.4. This indicates that the bearish exposure is still significant but not going into a new historical extreme.
Overall, the latest figures suggest that the improvement seen a week earlier was short-lived, with bearish conviction towards the Aussie returning as participation increased. Still, the stabilisation in 4-week momentum points to a more mature bearish positioning environment: investors remain firmly negative on the AUD, but so far there is little evidence of a renewed acceleration in the broader selling trend.
What’s next for AUD?
Next on tap on the domestic calendar is the publication of the preliminary S&P Global Manufacturing and Services PMI on Friday.
Technical levels
In the daily chart, AUD/USD trades at 0.7109, maintaining a constructive bullish bias as spot holds above the 55-, 100- and 200-day simple moving averages (SMAs) clustered between 0.7001 and 0.6949. The pair is also supported by nearby horizontal demand at 0.7079, while a firm Relative Strength Index (RSI) around 62 suggests positive but not yet overbought momentum, and a low Average Directional Index (ADX) near 14 indicates that the uptrend lacks strong directional conviction for now.
On the downside, initial support appears at 0.7079, ahead of the 100-day SMA at 0.7067 and the 55-day SMA at 0.7001, with the 200-day SMA at 0.6949 reinforcing a broader bullish floor above the 0.6833 horizontal level. On the topside, AUD/USD faces initial resistance around 0.7278–0.7283, with a more distant barrier at 0.7661, and a sustained break above the former would open the way for an extension of the advance toward the latter.
(The technical analysis of this story was written with the help of an AI tool. Know more.)
The line in the sand remains the 200-day SMA
AUD/USD retains a constructive medium-term structure above its 200-day SMA, but the immediate outlook remains uncertain while the pair struggles to secure a foothold well above 0.7100.
The most attractive setup remains conditional: confirmed acceptance above 0.7100 would favour further gains and could trigger a positioning-driven short squeeze. Another rejection, however, would leave the pair exposed to a breach below 0.7000.
Until one of these boundaries breaks, AUD/USD remains caught between supportive Australian fundamentals and an external backdrop still dominated by the US Dollar, geopolitical uncertainty and only moderate support from China.
GDP FAQs
A country’s Gross Domestic Product (GDP) measures the rate of growth of its economy over a given period of time, usually a quarter. The most reliable figures are those that compare GDP to the previous quarter e.g Q2 of 2023 vs Q1 of 2023, or to the same period in the previous year, e.g Q2 of 2023 vs Q2 of 2022. Annualized quarterly GDP figures extrapolate the growth rate of the quarter as if it were constant for the rest of the year. These can be misleading, however, if temporary shocks impact growth in one quarter but are unlikely to last all year – such as happened in the first quarter of 2020 at the outbreak of the covid pandemic, when growth plummeted.
A higher GDP result is generally positive for a nation’s currency as it reflects a growing economy, which is more likely to produce goods and services that can be exported, as well as attracting higher foreign investment. By the same token, when GDP falls it is usually negative for the currency. When an economy grows people tend to spend more, which leads to inflation. The country’s central bank then has to put up interest rates to combat the inflation with the side effect of attracting more capital inflows from global investors, thus helping the local currency appreciate.
When an economy grows and GDP is rising, people tend to spend more which leads to inflation. The country’s central bank then has to put up interest rates to combat the inflation. Higher interest rates are negative for Gold because they increase the opportunity-cost of holding Gold versus placing the money in a cash deposit account. Therefore, a higher GDP growth rate is usually a bearish factor for Gold price.
Author

Pablo Piovano
FXStreet
Born and bred in Argentina, Pablo has been carrying on with his passion for FX markets and trading since his first college years.