Australian Dollar hits an all-time COT extreme as Natural Gas reaches a 348-report reading [Video]

An exceptional positioning signal in the Australian dollar points to potential medium-term strength, while natural gas, sterling and copper illustrate why the timing and type of COT signal matter.
The Australian dollar has reached an all-time COT extreme in the net positions of both Large Speculators and Commercials. It is the clearest development in the 43rd Commitments of Traders report of 2026, and a historically unusual alignment between two major participant groups.
I read the extreme as supportive of higher Australian dollar prices over the medium to longer term. That is not the same as predicting an immediate move: a record positioning reading identifies an unusual market condition, not the precise session in which price must respond.
The Australian dollar’s extreme supports an existing advance
In the classic COT report, Large Speculators are the larger speculative participants, while Commercials are generally hedgers with exposure to the underlying market. Their net positions should not be interpreted as identical directional bets. Nevertheless, both groups reaching an all-time extreme makes the current Australian dollar setup particularly noteworthy.
The price context also matters. The Australian dollar has already been rising since earlier in 2026. In this case, the bullish extreme is not primarily a call for a reversal from a prolonged decline; it suggests that an established advance may have further room to develop.
This is why I would put greater weight on the medium- to long-term implication than on a short-term entry point. Positioning can remain exceptional while prices consolidate or move unevenly. The signal supports continued strength, but subsequent price action must determine whether that expectation is realised.
Natural gas shows a bullish extreme stretching back to 2020
Natural gas is the other major historical reading this week. Large Speculators have reached a 348-report COT extreme in net positioning. On the ten-year chart, that takes the comparison back to around 2020, roughly six and a half years ago.
The extreme is bullish, but the earlier episode is a useful reminder about patience. In 2020, a comparable positioning condition emerged before the market had completed its bottom. The historical parallel helps explain why a bullish COT extreme does not necessarily provide immediate price confirmation.
I would therefore treat natural gas as a market with an unusually strong longer-horizon positioning signal, while keeping timing expectations restrained. The latest report does not establish that a bottom is already in place.
Sterling’s bearish change conflicts with its longer-term positioning
The British pound offers a different sort of evidence. Commercials registered a 21% change in net positions, producing a bearish short-term COT change signal. The iCOT Scores also lean bearish, although the reading is one-sided and weaker than the signal observed in August.
Yet the five-year COT extreme analysis presents a bullish longer-term picture. Rather than forcing those observations into one forecast, I would keep their time horizons separate: the near-term evidence points to possible weakness, while longer-term positioning remains more constructive.
That difference is material. A positioning change measures recent movement; it is not interchangeable with the level or historical extremity of positions.
Copper’s 22% change does not erase its bearish long-term extreme
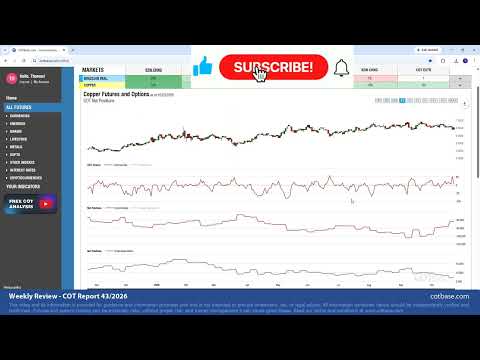
Copper shows a 22% change in Commercial net positions, a larger-than-average bullish change signal suggesting the possibility of near-term strengthening. There has already been some price reaction to a recent change reading, although the delay illustrates one of the limits of weekly COT information: Tuesday’s positions are published on Friday.
The longer-term assessment points the other way. Copper recently reached an all-time COT extreme, which I interpret as suggesting a meaningful possibility of lower prices over the medium to longer term. A short-term bullish change can coexist with that bearish historical backdrop; neither should be presented as cancelling the other.
The key is to distinguish historical extremes from short-term changes
This week’s strongest signal is the Australian dollar’s all-time extreme across both major trader groups, with natural gas providing another rare, bullish historical reading. Sterling and copper show why it would be misleading to treat every COT observation as a forecast on the same horizon.
In my view, the practical task is to identify which markets have genuinely exceptional positioning, which have only a recent change, and what price action is still needed. COT data adds important context, but it cannot replace confirmation or remove timing risk.
For the full chart-by-chart explanation of this week’s findings, watch my latest COT review
This content was partially created by an AI tool.
Author

Thomas Lukacs
COTBase.com
Thomas Lukacs is the founder and CEO of COTbase.com.