AUG (gold/silver ratio) showing a five waves from 03.18.2020

AUG( Gold/Silver Ratio), Showing A Five Waves From 03.18.2020.
The Ratio between Gold/Silver ( AUG) is a very good indicator of where the market is heading and especially the $USDX trade. The Ratio reached the extreme blue box area early this year when it trades into the 126.23 peaks. We at Elliottwave-forecast always relate the Market and understand how each instrument affects the other. When the Ratio reached the blue box area because we knew that the market was closed for a turn against the $USDX. And it will then affect the value of Silver in a quite simple equation i.e higher Silver means lower $USDX. Similarly lower Silver means higher $USDX. We will explain the forecast below.
Gold to silver ratio ( AUG) monthly chart
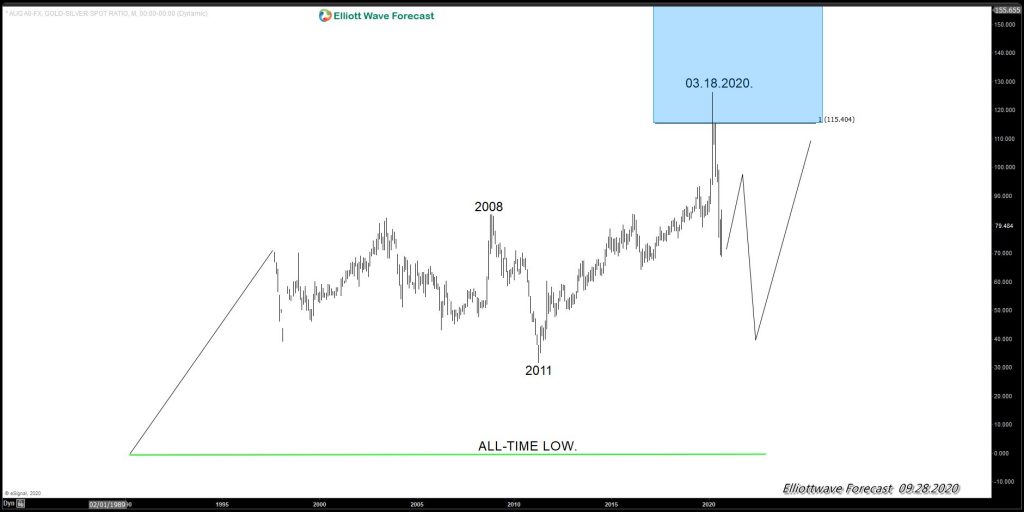
The following chart represented the advance in the Ratio since the old-time lows, and show how the Blue Box area was reached. Meaning a change in dynamics and how we see the relationship between Gold and Silver. The Ratio trading higher means that Gold holds the value more than Silver. But most important means the $USDX is supported. We understand many will not be able to see the relationship between Gold trading higher and $USDX trading either sideways to higher or sideways to lower. The Ratio is like commodities crosses it is a balance between three instruments and always one needs to be sideways.
In this case, Gold, Silver, and USDX, we believe Gold will lag Silver into the news cycle and the $USDX will be the one losing ground. While Gold was leading Silver since 2016. It has been trading higher while Silver trade sideways and even took 2016 low. While $USDX makes a new high in the same period. The blue box reaching means the dynamics change and consequently knowing that will allow traders to get the best out of the Market. Early this year, we presented an article that explains exactly what the Market has been doing.
The article explains that Silver was about to turn higher and the $USDX will turn lower. As right now, we know the Ratio reached the Blue Box and turned lower. We already saw $XAGUSD (Silver) rally and $XAUUSD(Gold) taking the 2011 peak, which was expected. Now, something else has happened, the Ratio is showing a clear five waves decline off the peak at the Blue Box. The idea is explained in the following chart:
Gold to silver ratio ( AUG) daily chart
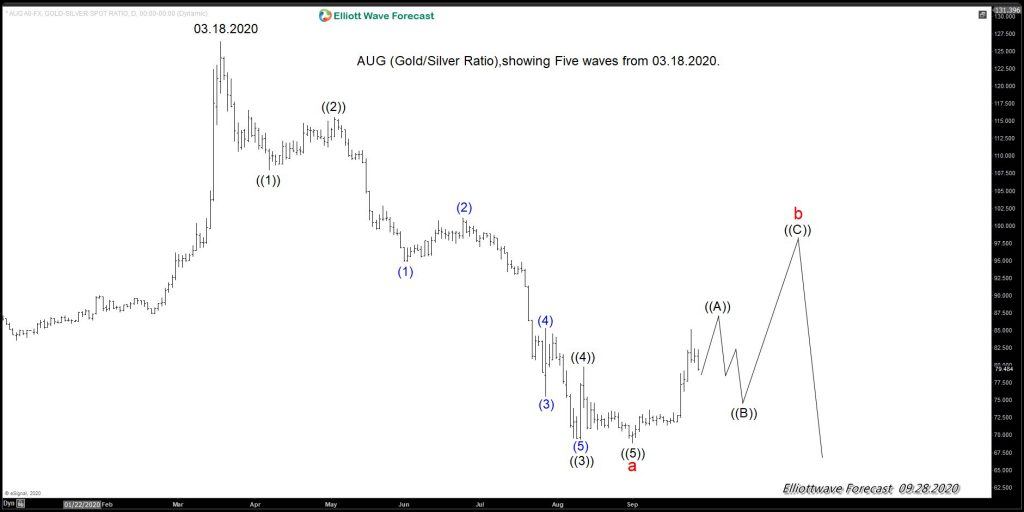
The Idea presents the path into three waves bounce and then should see more downside. It will present a unique opportunity for those that understand how the Market works. As we always said, the Market is a series of three instruments, and the five waves lower in the ratio are telling us who will be the winner and who will be losing. The Five waves are telling us where to place our investment and why the $USDX will be the one losing. But also will be telling us that Silver will rally a lot and will be a long term opportunity.
Author

Elliott Wave Forecast Team
ElliottWave-Forecast.com


