AUDUSD trend turns up as per triple moving average measurements

-636771945786842243.png)
The above chart shows daily price action. The AUDUSD is in a mark-up phase. This phase is typically defined by a bullish EMA formation. The green 5-day EMA > the orange 13-day EMA > the black 34-day EMA. The RSI(9) is above the 50 level and indicative of an underlying bullish momentum (blue rectangle). If the EMAs start developing angle and separation it is likely to be on the back of further AUDUSD strength.
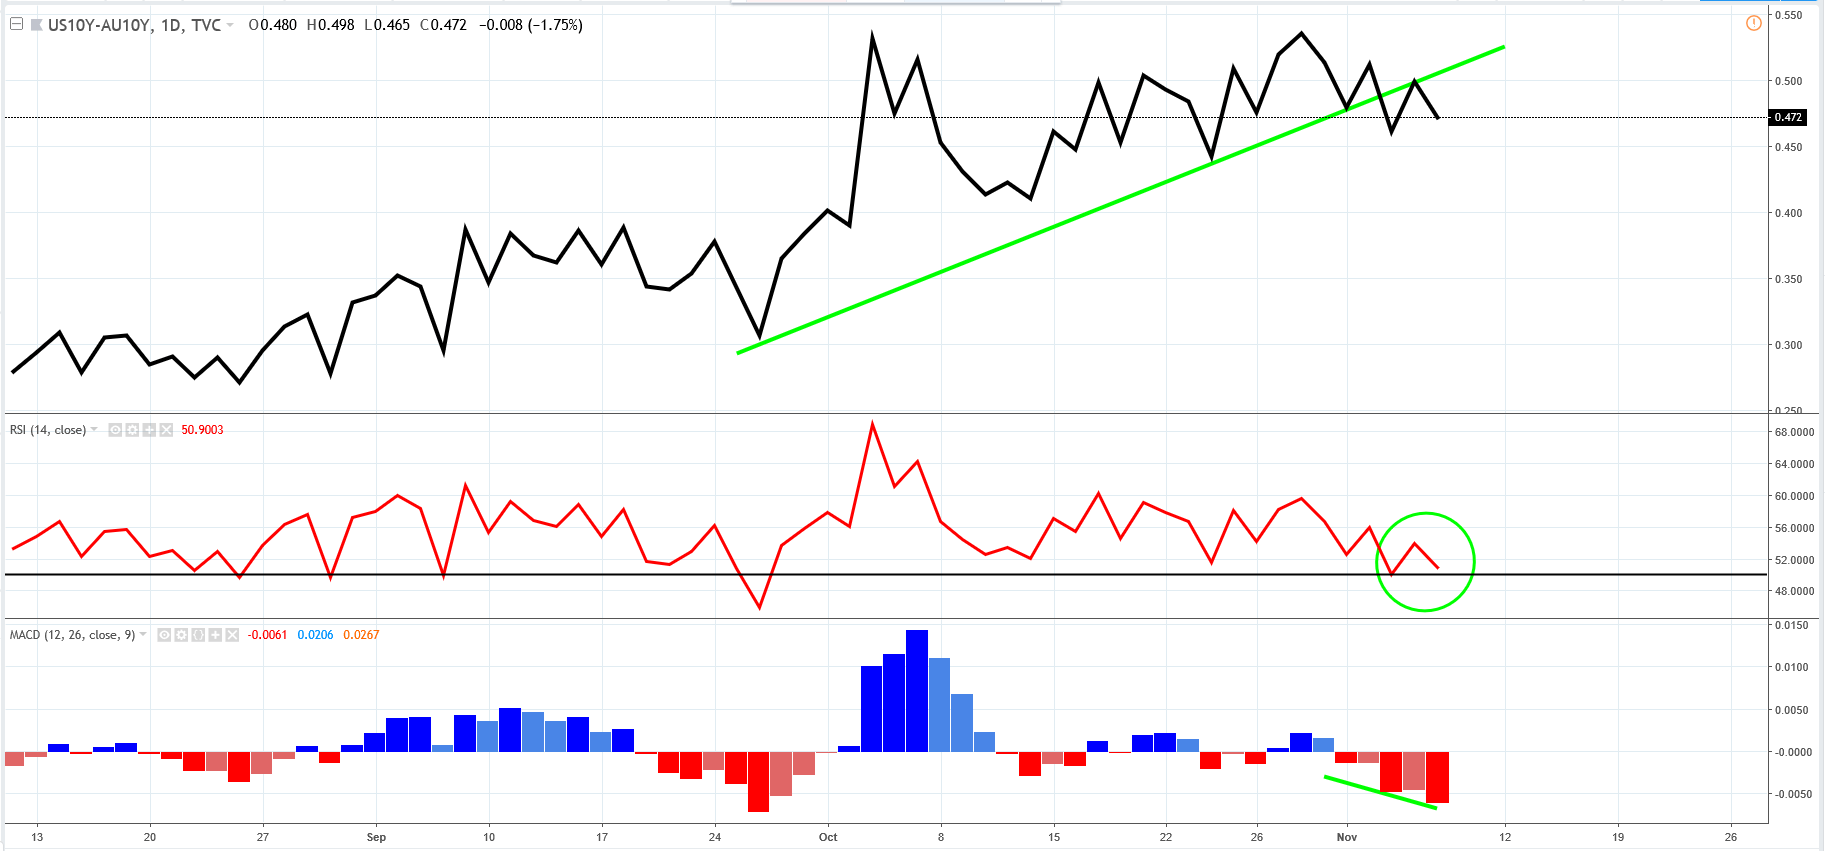
The above chart shows daily price action of the spread between the US 10-Yr note and the Aussie 10-Yr note. The spread has narrowed slightly. It has broken below its upward sloping trendline as momentum declines. Although the MACD has ticked down in support, for the spread to narrow significantly, we would like to see the RSI(14) to cross below the 50 level. This would denote an underlying bearish momentum.
Author

Russell Shor (MSTA, CFTe, MFTA) has an Honours Degree in Economics from the University of South Africa and holds the coveted Certified Financial Technician and Master of Financial Technical Analysis qualifications from the Interna


