AUD/USD Price Forecast: US-China trade tensions cap gains near 0.6200 confluence, ahead of US CPI
- AUD/USD climbs to a fresh weekly high on Thursday, though it lacks follow-through buying.
- The optimism over Trump’s tariff pause and modest USD downtick lend support to the pair.
- The escalating US-China trade war caps the upside for the Aussie ahead of the US CPI report.

The AUD/USD pair extended the previous day's solid recovery move from the vicinity of the 0.5900 mark, or its lowest level since March 2020, and attracted buyers for the second consecutive day on Thursday. The momentum pushed spot prices to a fresh weekly top, around the 0.6200 round figure during the early European session, and was sponsored by the latest optimism led by US President Donald Trump's tariffs pause. In less than 24 hours after steep new tariffs kicked in on Wednesday, Trump took a U-turn and abruptly backed off his hefty reciprocal duties on most US trading partners for 90 days. The announcement eased worries about the global economic impact of US trade policies, triggering a sharp rally in equity markets and boosting demand for perceived riskier currencies, including the Australian Dollar (AUD).
The US Dollar (USD), on the other hand, got a minor lift on Wednesday after the minutes from the March 18-19 FOMC meeting revealed that officials almost unanimously agreed that the US economy was at risk of experiencing higher inflation. Moreover, policymakers called for a cautious approach to interest rate cuts, forcing investors to trim their bets for more aggressive easing by the Federal Reserve (Fed). Traders, however, are still pricing in the possibility that the US central bank will resume its rate-cutting cycle in June and deliver around 75 basis points of rate reductions by the year-end. This, along with the upbeat market mood, undermines demand for the safe-haven Greenback. However, worries about the escalating US-China trade war keep a lid on any further gains for the China-proxy Aussie and the AUD/USD pair.
Trump jacked up the tax rate on goods from China to 125% in response to the latter's retaliatory 50% additional tariffs on US imports. Furthermore, China vowed to fight to the end and said it was launching an additional suit against the US at the World Trade Organization. Meanwhile, China’s Commerce Ministry said in a statement on Thursday that its position on trade is clear and consistent, and that pressure, threats, and blackmail is not the right way to deal with China. Moreover, the Chinese Commerce Ministry and Foreign Ministry issued a joint statement, reaffirming to continue taking resolute countermeasures to safeguard its interests. This holds back traders from placing aggressive bullish bets around the AUD/USD pair ahead of the release of the latest US consumer inflation figures later during the North American session.
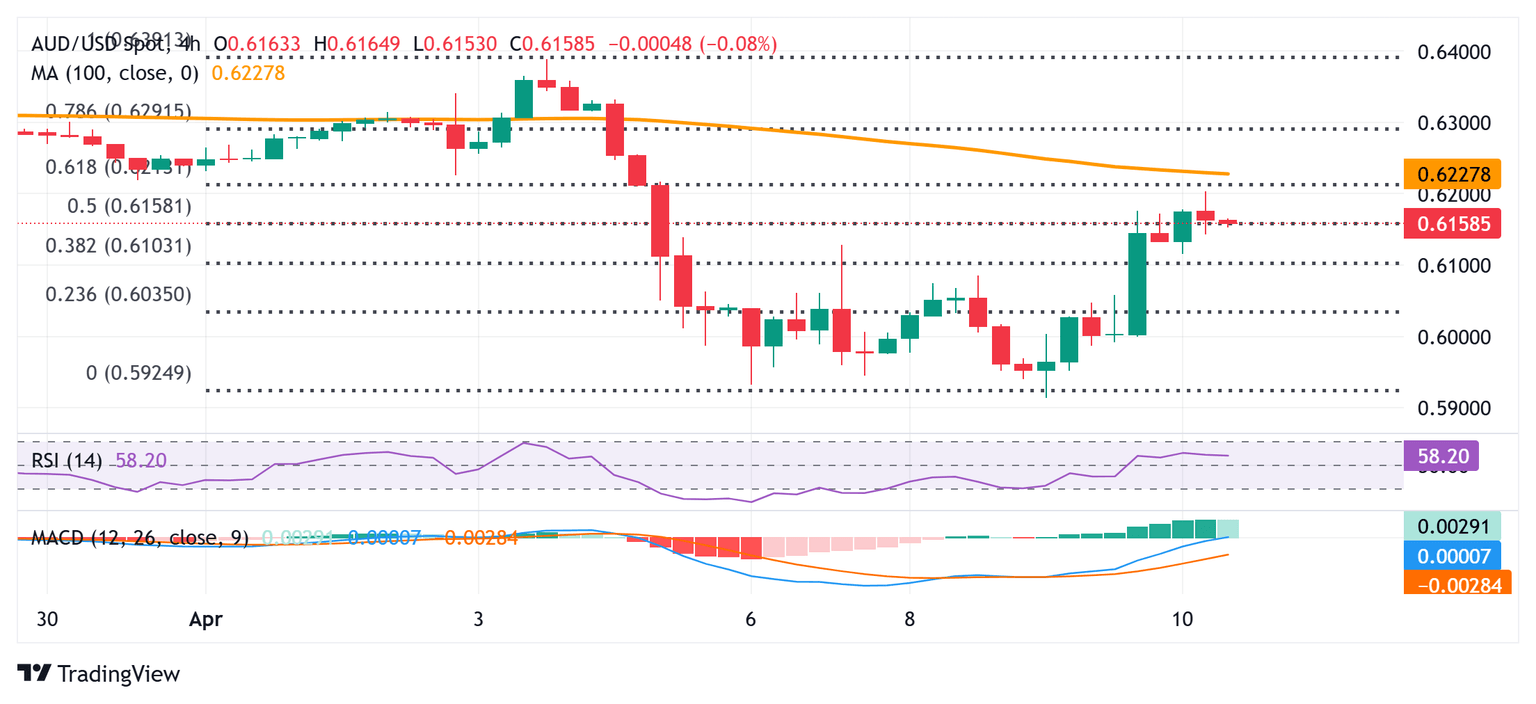
AUD/USD 4-hour chart
Technical Outlook
From a technical perspective, the intraday move-up struggles to make it through the 0.6200-0.6205 confluence hurdle. The said area comprises the 61.8% Fibonacci retracement level of the recent slump from last week's swing high and the 100-period Simple Moving Average (SMA) on the 4-hour chart. A sustained strength beyond might trigger a fresh bout of a short-covering move and lift the AUD/USD pair beyond the 0.6245 intermediate hurdle, towards the 0.6300 mark en route to the 0.6325-0.6330 supply zone. Some follow-through buying should pave the way for a move towards retesting the monthly top, around the 0.6400 neighborhood touched last Thursday.
On the flip side, the Asian session low, around the 0.6115 region, now seems to protect the immediate downside ahead of the 0.6100 mark, or the 38.2% Fibo. level. Failure to defend the said support levels could make the AUD/USD pair vulnerable to accelerate the slide further towards the 0.6040 horizontal support en route to the 0.6000 psychological mark. The downward trajectory could extend further and eventually drag spot prices to the 0.5955 intermediate support en route to the 0.5915-0.5910 region, or a multi-year low touched on Wednesday.
Premium
You have reached your limit of 3 free articles for this month.
Start your subscription and get access to all our original articles.
Author

Haresh Menghani
FXStreet
Haresh Menghani is a detail-oriented professional with 10+ years of extensive experience in analysing the global financial markets.


